Bar Graphs
Pie Charts
Line Graphs
Scatter Plots
100

Which is the second most popular super hero?
Iron Man
100
What is the survey sample size?
20 people
100
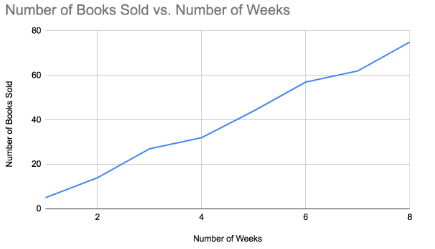
Is the number of books sold increasing or decreasing?
Increasing
100

Between what 2 years did Jack experience the least growth?
12 - 14
200

How many more people prefer fish to dogs.
1 person.
200

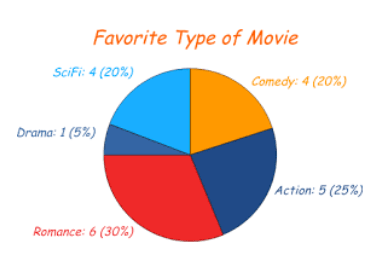
What is the combined percentage of people who enjoy science museums, art galleries, history museums, and nature preserves?
100%
200

In what year was there $6000 in the bank?
1999
200

What is the percentage frequency of students who studied 7 hours?
20%
300

Was the sample size smaller or larger than 75 students?
Yes, it was about 81 students.
300

What is the relative frequency of people who play hockey?
0.34
300

On which day did the plant grow the fastest?
Day 7 or 8
300
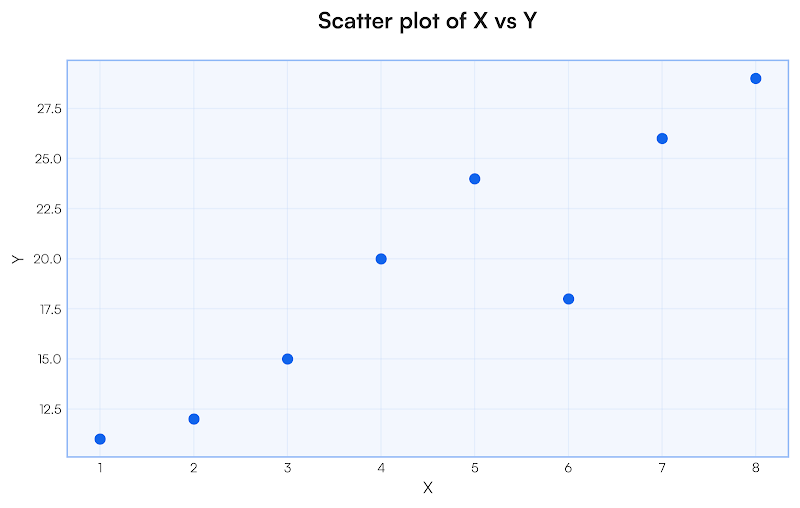
DOUBLE JEOPARDY: What is the x value of the outlier?
6
400
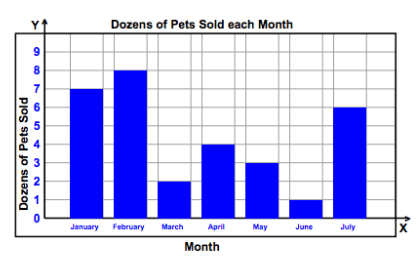
How many total pets were sold in the months of march, april, and may?
108 pets
400

If 250 litres of water was used during this survey, how many litres were spent washing clothes?
54.25 litres
400

How tall was Caitlin at 3 years of age?
35 inches
400

What is the pattern rule for Jack's Age?
2.5x + 30
500

In which months did the total units sold surpass the total number of transactions?
January, February, and March
500

The above graph shows peoples' prefered pizza toppings. If 4000 people were surveyed, how many people do not like olives on their pizza.
3616
500

In which week did we see the widest range of temperature changes?
Jan 14th - 21st, or 3rd week
500
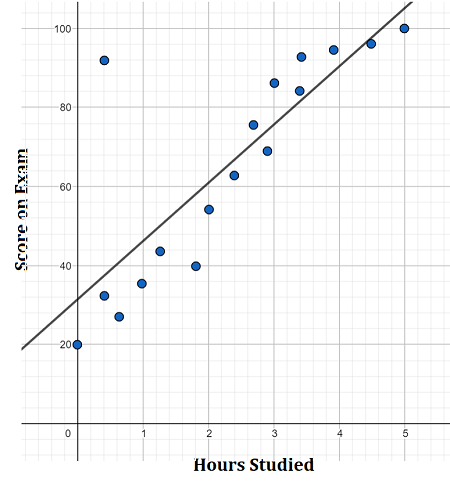
DOUBLE JEOPARDY: What is the x value of the outlier?
0.4