CMT
Graphs
Graphs #2 &(bonus question)
Variance & S.D.
Empirical Rule
100
Find the mean of the following data set:
5, 7, 9, 3, 6
6
100
The histogram below shows the number of students scoring in each range on a quiz.
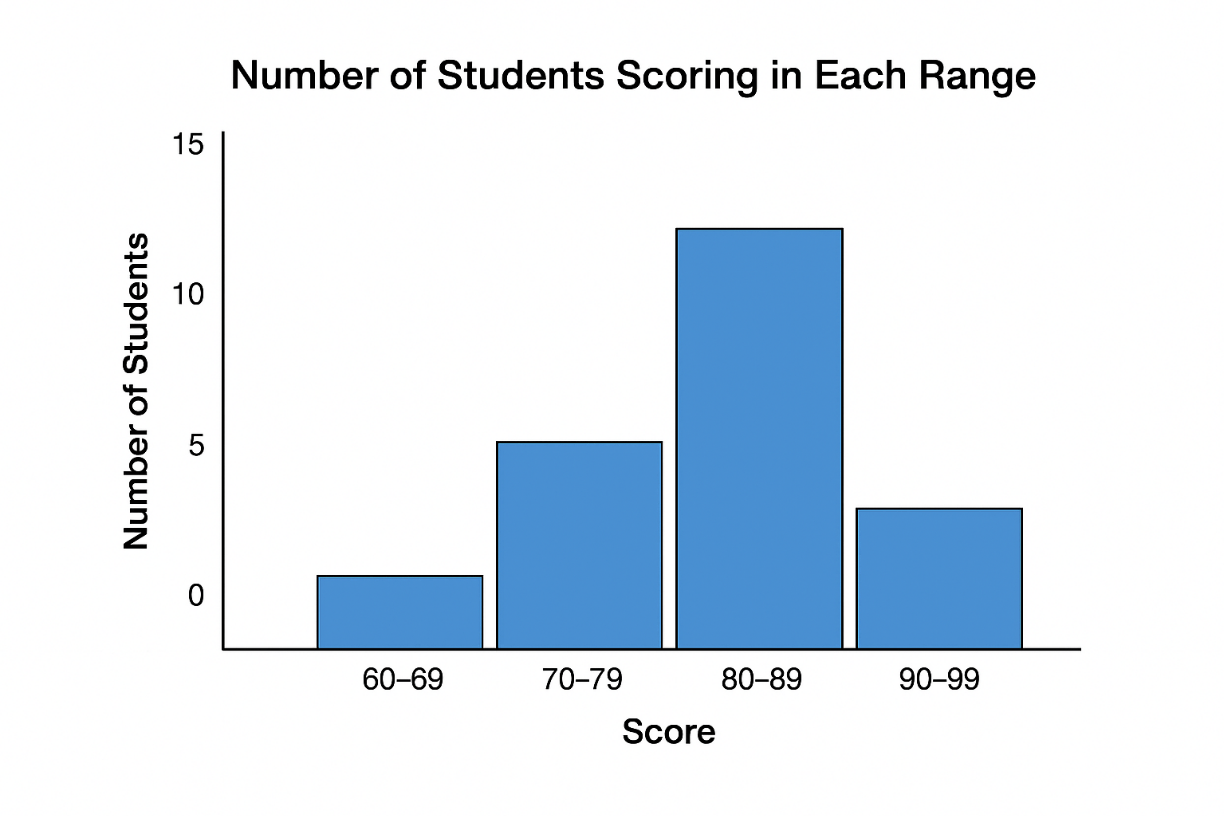
Which class interval has the highest frequency?
80-89
100
The stem-and-leaf plot below shows quiz scores.
How many total scores are in the data set?
7|2,5,8
8|0,3,7
9|1,2,9
9 (3 in each stem)
100
Write the formula for population variance and include the correct symbol in the formula.
sigma^2=(sum(x-mu)^2)/N
100
According to the empirical rule, approximately what percent of data lies within 1 standard deviation of the mean?
68% or 68.2%
200
Find the median of the following data set:
2, 8, 5, 4, 7, 9, 1
5
200
Identify the class width.

Class width = 10
200
In a pie chart showing students’ favorite drinks, 25% chose coffee.
If there are 80 students total, how many chose coffee?
.25(80)=20
200
Write the formula for the sample standard deviation and include the correct symbol.
s=sqrt((x-xbar)^2/(n-1))
200
According to the empirical rule, what percent of values live within the following range?
(-2sigma,1sigma)
34.1+13.6+34.1=81.8%
300
Find the mode and range of the data set:
4, 6, 6, 7, 9, 9, 9, 10
mode=9
range = 10-4 = 6
300
A relative frequency histogram displays quiz scores.
If the class of 70-79 has a relative frequency of .25 and the sample included 40 students, how many students received a score in the range of 70-79?
.25(40)=10
300
In a Pareto chart, the tallest bar represents “Texting” with 18 occurrences, followed by “Calling” with 12.
What can you infer about students’ phone habits?
Students prefer texting over calling
300
What is the difference between variance and standard deviation?
Define them in your own words.
Answers may vary
300
A data set is normally distributed with a mean of 100 and a standard deviation of 10.
What interval contains 99.7% of all values?
100+-3(10)=(70,130)
400
The data table below represents the number of hours students studied and the corresponding frequencies of the sample.
Hours 1 2 3 4 5
Frequency 3 6 5 4 2
Find the mean number of hours studied.
2.75
400
The cumulative frequency graph below depicts the retirement ages of college professors.
How many teachers are included in the data collection? How many teachers retired by 51.5 years of age? Approximately how many teachers retired by 71.5 years of age?
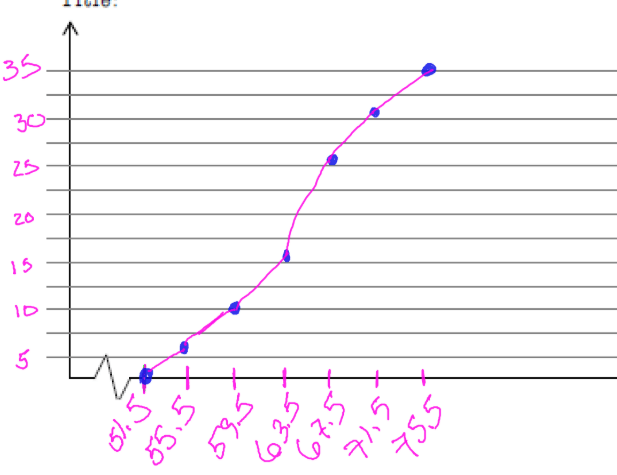
35
0
26
400

What percentage of students have a favorite genre that is not romance or action? If there are 50 students participating in the poll, how many are in favor of SciFi, Drama, and Action? How many students are not in favor of romance or action?
100 - (30+25)=45
.5(50)=25
.45(50)=22.5
400
A population data set is: 2,4,6,8,10
Find the mean, variance, and standard deviation. (Round to the nearest hundredth)
mu=6
sigma^2=8
sigma=2.83
400
In a normal distribution with mean 60 and standard deviation 8, what percent of data lie above 76?
76 is 2 S.D. to the right of the mean.
Since 95% of the data lies within 2 S.D. of the mean, then
100%-95% = 5% which is split between the two tails.
Therefore, above 76 we have 5%/2=2.5%
Acceptable answer (2.2%)
500
A statistics class has the following weighted grades:
Tests = 40%, Projects = 30%, Homework = 30%
Gunnar scored an 80% on tests, 90% on projects, and 70% on homework.
What is Gunnar's weighted mean grade in the class?
[80(.4)+90(.3)+70(.3)]/1=.8=80%
500
The frequency histogram below represents the wages of all workers at a company(in 1000's).

What is the shape of the distribution? How many workers are included in the data collection? Does this data reflect a parameter or a statistic?
approximately normal/skewed right
100
Parameter --> Population (all workers in the company)
500
BONUS: DAILY DOUBLE
Find all roots/zeros of the function below.
f(x)=x^3-2x^2-5x+6
-2,1,3
500
A geometry class consisting of 6 students completed a test. The following data of student scores is collected: 70, 75, 80, 85, 90
Find the standard deviation of the data set. (Round the nearest hundredth)
(xbar)=80; s^2=62.5; s=7.91
500
A normal distribution of test scores has a mean of 80, a standard deviation of 5, and 100 total students.
Estimate how many students scored between 75 and 90.
75 is 1 S.D. below the mean (34.1%)
90 is 2 S.D. above the mean (34.1%+13.6%)=(47.7%)
Therefore, we have (34.1%+47.7%)= 81.8%
Finally, .818(100)=81.8