Tally Charts
Bar Graphs
Picture Graphs
Tens and Ones
Addition and Subtraction
100
___ children chose football.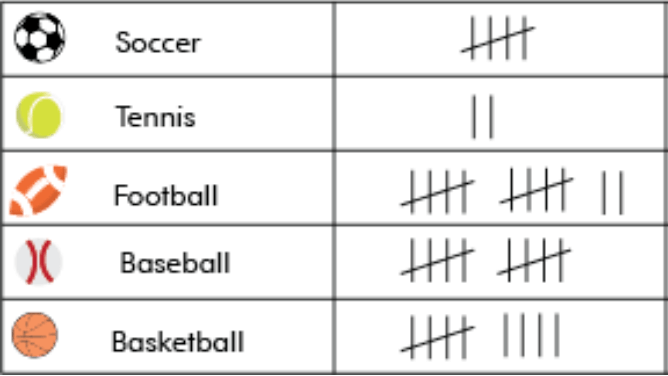
12 children chose football.
100
What is this graph measuring?
This graph measures the type of weather each day.
100
How many children chose milk?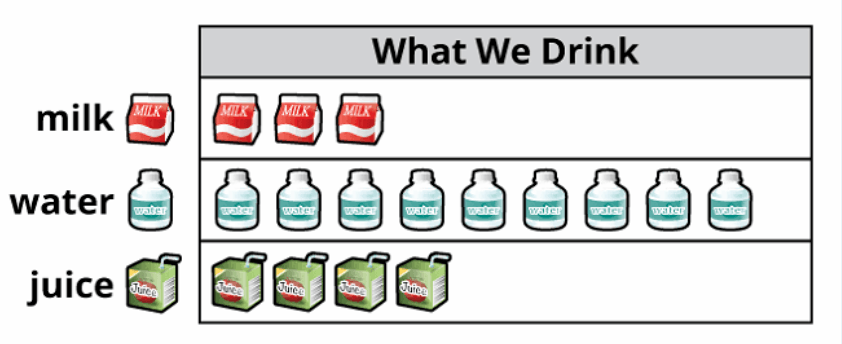
3 children chose milk.
100
How many tens are in 63?
6 tens
100
5+5= _____
10
200
Which sport was chosen the most?
Football
200
__ days were cloudy.
3 days were cloudy.
200
___ more people chose water than juice.

5 more people chose water than juice.
200
87= ____ tens ______ ones
8 tens and 7 ones
200
1+___=10
9
300
Which sport was chosen the least?
Tennis
300
_____ weather happened for 7 days.

Snowy weather happened for 7 days.
300
_____ was chosen by 9 children.
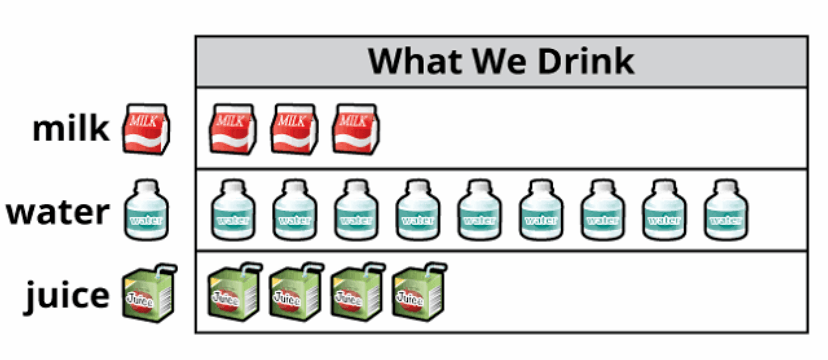
Water was chosen by 9 children.
300
______ = 7 tens 9 ones
79
300
9+8=_____
17
400
 Soccer had __ less votes than basketball.
Soccer had 4 less votes than basketball.
400
There were ___ more rainy days than snowy days. 
3
400
There are ____ pets altogether.

There are 18 class pets altogether.
400
4 less than thirty is
26
400
90 - 4 tens =___
50
500
Which sport had more votes than basketball but less votes than football?
Baseball
500
How many days were measured altogether?
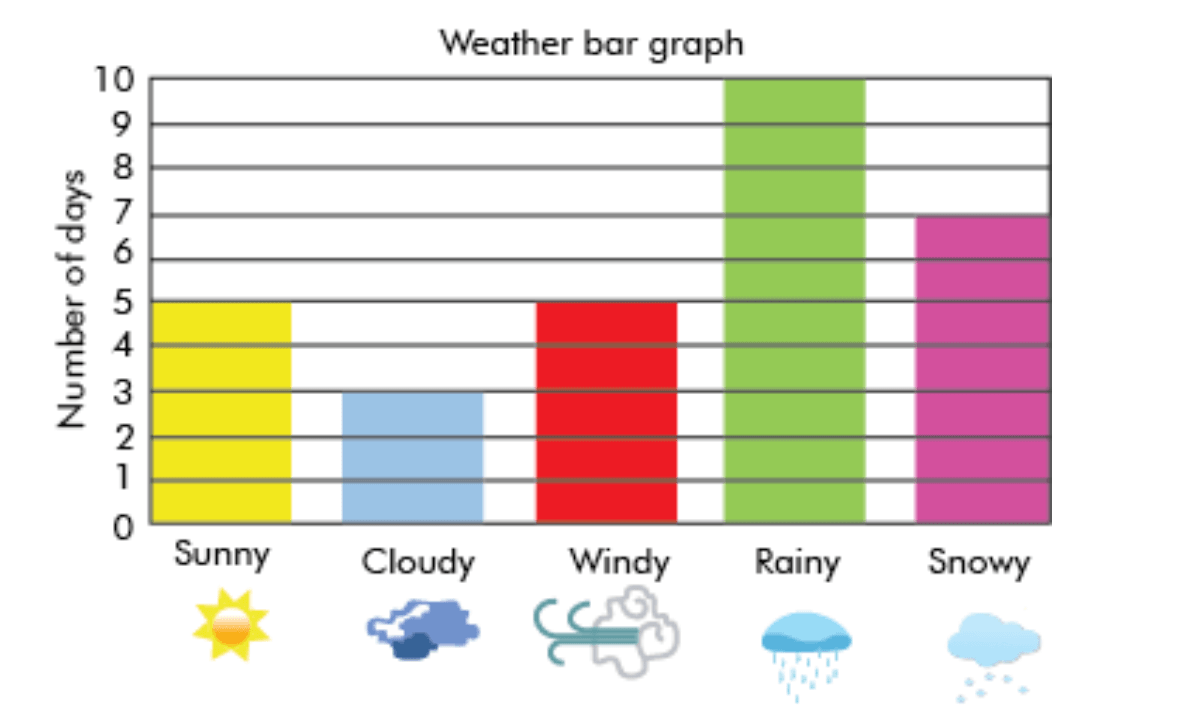
30 days were measured altogether.
500
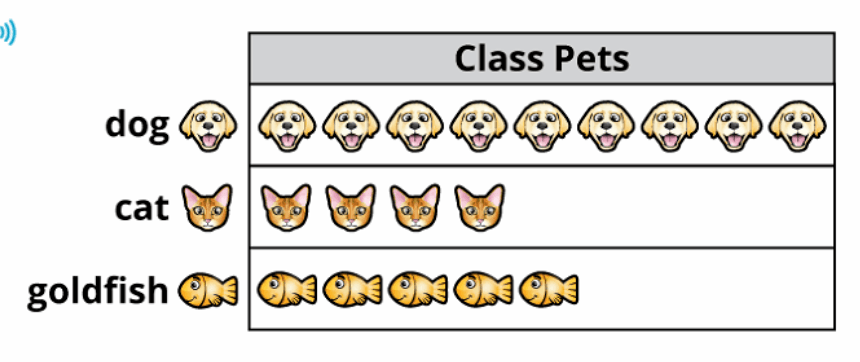 There are ___ less fish than dogs.
There are 4 less fish than dogs.
500
5 more than 25 = ____tens ______ ones
500
24+33=___
57