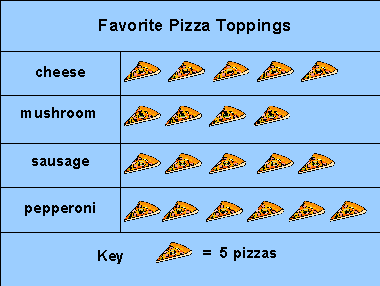
Picture graphs use a _____ to tell you how much each picture is worth.
Key
Line Plots Question 100
8 bracelets
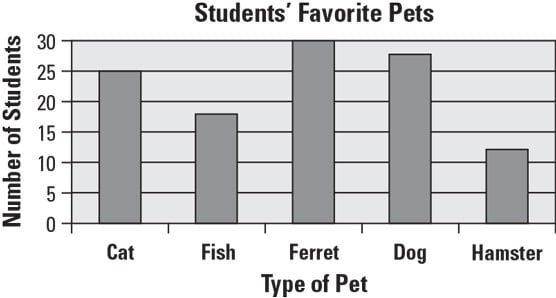
what is the title of this graph?

Students favorite pets
What does the key tell us about the graph?

Each piece of fruit equals 2
How much does each orange represent on this graph?

2
What type of graph uses x's on a line to show measurement data?
Line Plot
Line Plots Question 200
$40
What is the graph counting by?

2's
How many people were surveyed?

18
What does the key say about how many people love baseball and soccer?

14
This kind of graph uses bars to display the data?
Bar Graph
Line Plots Question 300
5 more
How many people like Snickers and Reeces?

14
How many people like mushroom and cheese pizza?

45
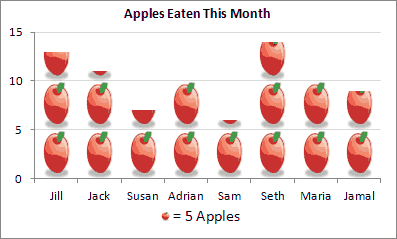
What type of key was used in this survey?

an apple equals 5
This kind of graph uses pictures or symbols to represent the data?
Picture Graph
Line Plots Question 400
21 bracelets
How many goldfish and cats does this person own?

6
How many cupcakes were sold on Tuesday?

15
How many people were surveyed?

21
Marks made to keep track of things during a survey.
Tally marks
Line Plots Question 500
$173
How many cats and Ferrets does this person own?
55
How many more people like pepperoni than cheese?

5
How many people were surveyed?

100