Data Analysis I
Data Analysis II
APA Style
Grab Bag I
Grab Bag II
100
A group of marketing researchers collected data on the fuel efficiency of vehicles across different engine sizes in terms of the number of cylinders they have (i.e., 4, 6, and 8). The researchers then statistically compared fuel efficiency in terms of miles per gallon (MPG) across these three independent groups. They predicted that four-cylinder cars would demonstrate significantly lower MPG than 6- and 8-cylinder cars.
What is the dependent variable in this scenario?
Fuel efficiency
100
A demographic researcher has been tasked with examining the racial breakdown of which demographic groups voted for which candidates in the most recent election. Which descriptive statistic should they use?
Frequencies
100
When authors use figures to display their data (e.g., scatterplots for correlations) in which section of an APA paper are they usually seen?
Results
100
What section of a journal article should contain an up-to-date research review?
Introduction
100
Any study that uses a within-subjects design with only two levels/measurements should plan to use which analysis?
Paired-samples t-test
200
A group of marketing researchers collected data on the fuel efficiency of vehicles across different engine sizes in terms of the number of cylinders they have (i.e., 4, 6, and 8). The researchers then statistically compared fuel efficiency in terms of miles per gallon (MPG) across these three independent groups. They predicted that four-cylinder cars would demonstrate significantly lower MPG than 6- and 8-cylinder cars.
What type of study design is this?
Between-subjects, non-experiement
200
Some researchers are interested in understanding how getting into arguments on social media impacts the emotional states of users. They expected to find that those who engage in an online argument will report more anger after the interaction than will those who engage in a social media interaction with no argument. To test this hypothesis, they randomly assigned participants to either have an argument on social media or a normal social media interaction and then measured their levels of anger.
What type of study design is described in this scenario?
Between-subjects experiment
200
How are references organized in an APA-style references section?
In Alphabetical order
200
Which outcome is the least likely from the peer-review process?
Accepted without revisions
200
Any study using a factorial design with at least one within-subject component must use which analysis?
Repeated Measures ANOVA
300
A group of marketing researchers collected data on the fuel efficiency of vehicles across different engine sizes in terms of the number of cylinders they have (i.e., 4, 6, and 8). The researchers then statistically compared fuel efficiency in terms of miles per gallon (MPG) across these three independent groups. They predicted that four-cylinder cars would demonstrate significantly lower MPG than 6- and 8-cylinder cars.
How many IVs and Levels are in this study?
1 IV; 3 Levels
300
Some researchers are interested in understanding how getting into arguments on social media impacts the emotional states of users. They expected to find that those who engage in an online argument will report more anger after the interaction than will those who engage in a social media interaction with no argument. To test this hypothesis, they randomly assigned participants to either have an argument on social media or a normal social media interaction and then measured their levels of anger.
How many IVs and how many levels are described in this scenario?
1 IV; 2 levels
300
In what section of a journal article would you find detailed interpretations or explanations of the results of that specific study?
Discussion
300
What does Cohen’s d tell us in a t-test analysis?
The difference between groups/measurements in standardized units
300
A team of researchers hypothesized that high socio-economic status is positively associated with self-control. To test this hypothesis, they conducted an online survey study with over 750 participants. The researchers collected information on various other traits and participants demographic characteristics as well to report in their write-up.
If this team of researchers wanted to control for participant age in their final analysis, what should they use instead of a bivariate correlation?
Multiple regression
400
A group of marketing researchers collected data on the fuel efficiency of vehicles across different engine sizes in terms of the number of cylinders they have (i.e., 4, 6, and 8). The researchers then statistically compared fuel efficiency in terms of miles per gallon (MPG) across these three independent groups. They predicted that four-cylinder cars would demonstrate significantly lower MPG than 6- and 8-cylinder cars.
What analysis should be used to analyze the data from this study?
One-way ANOVA
400
A team of researchers were interested in testing the relationship between trait aggression and self-control. However, they read in the literature that both of these variables are also related to trait neuroticism and thus they decide to control for this variable in their analysis. As such, the researchers applied a multiple regression to their data after collecting it. The authors predicted that there would be a negative relationship between trait aggression and self-control after controlling for neuroticism.
How many IVs and levels are described in this scenario?
2 IVs; no levels
400
Where in an APA style paper should you write your hypothesis?
Last paragraph of the introduction
400
A researcher is interested in testing the relationship between gun violence and poverty in a neighborhood but they are not concerned with controlling other variables statistically. Which analysis should they use?
Bivariate correlation
400
A team of researchers hypothesized that high socio-economic status is positively associated with self-control. To test this hypothesis, they conducted an online survey study with over 750 participants. The researchers collected information on various other traits and participants demographic characteristics as well to report in their write-up.
What study design is described in this scenario?
Correlational design
500
A team of researchers were interested in testing the relationship between trait aggression and self-control. However, they read in the literature that both of these variables are also related to trait neuroticism and thus they decide to control for this variable in their analysis. As such, the researchers applied a multiple regression to their data after collecting it. The authors predicted that there would be a negative relationship between trait aggression and self-control after controlling for neuroticism.
Given the SPSS output below, what should the researchers conclude about their hypothesis?
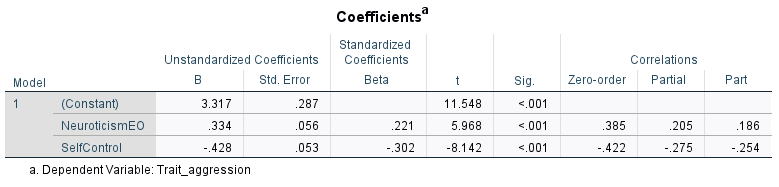
Reject the null
500
A team of researchers hypothesized that high socio-economic status is positively associated with self-control. To test this hypothesis, they conducted an online survey study with over 750 participants. The researchers collected information on various other traits and participants demographic characteristics as well to report in their write-up.
The image below shows the final result of their test. Given their hypothesis and this result, what should they conclude?
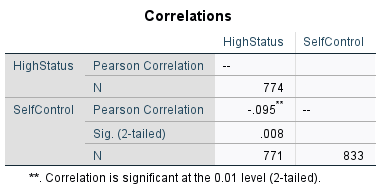
Fail to reject the null
500
Where should a reader look for details on the operational definitions (i.e., how they were measured) of the variables in a given study?
Materials subsection of the methods
500
Some researchers are interested in understanding how getting into arguments on social media impacts the emotional states of users. They expected to find that those who engage in an online argument will report more anger after the interaction than will those who engage in a social media interaction with no argument. To test this hypothesis, they randomly assigned participants to either have an argument on social media or a normal social media interaction and then measured their levels of anger.
Given the SPSS output below, what should they conclude about their hypothesis?
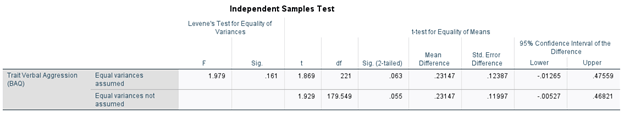
Reject the null
500
I designed and conducted a non-experimental study comparing the attitudes of customers about peanut butter brands. Specifically, I compared the preferences of people who shop at Kroger, Trader Joe’s, and Food Lion. Which analysis should I use in this context?
One-way ANOVA