A
B
100
What is the slope and y-intercept of the table, equation and graph?
y=2/3x-4

Equation: slope: 2/3 y-intercept -4
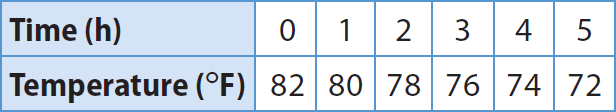
Table: slope: -2 y-intercept 82
Graph: slope: 2 y-intercept 4
100
Is the equation, graph and table functions? If yes are they linear or nonlinear?
y=x2+5 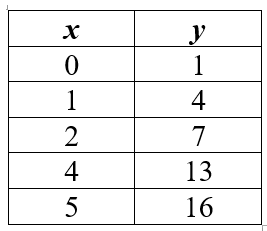

Yes they are all functions
The equation and graph are nonlinear
The table is linear
200
Is the equation, table and graph functions? If yes are they linear or nonlinear?
y=2/3x-4
The equation, table and graph are all functions. And they are all linear.
200
Are the graphs functions? If yes, are they linear or non linear?
They are both functions. The blue is linear and the red is nonlinear.
300
Does the equation, table or graph have the greatest constant rate of change?
y=2/3x-4
Equation: slope is 2/3
Table: slope is -2
Graph: slope is 2
The graph has the greatest slope so it has the greatest rate of change.
300
Which has the smallest initial value the equation, table or graph?
y=x2+5
Equation: y-intercept is 5
Table: y-intercept is 1
Graph: y-intercept is -3
The graph has the smallest initial value of -3.
400
Which has the smallest initial value, the equation, table or graph?
y=2/3x-4
Equation: y-intercept is -4
Table: y-intercept is 82
Graph: y-intercept is 4
The equation has the smallest initial value of -4.
400
Which graph has the largest initial value the blue or red graph? Why?
The blue graph has the largest initial value because it crosses the y-axis higher(about 5) then the red(about 0.5) graph.
500
What do the equation and graph have in common and how are they different?
y=3x
Similar: they both have a y-intercept of zero, they are both functions, they have a positive slope
Different: the equation is proportional the graph is not, the equation is linear, the graph is nonlinear.
500
Which graph has the fastest rate of change? Explain.
The red graph has a steeper incline then the blue. So the red has a greater rate of change. The slope of the red is larger then the blue.