Vocab
Show me
Random
Bar Graphs
Line Plots
100
Uses bars to show data (there are two types)
Bar Graph
100
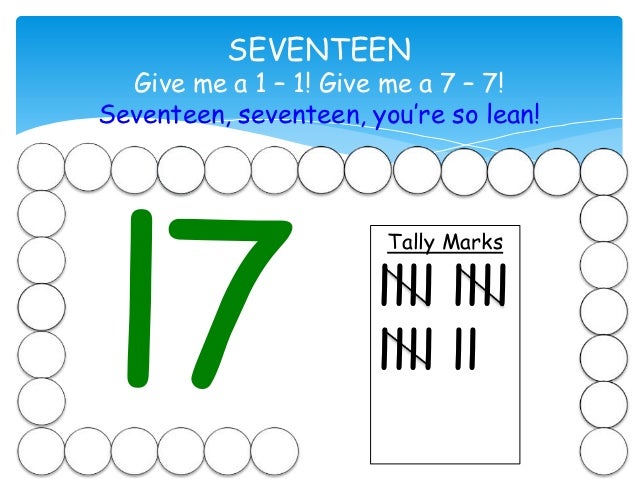
Show me the number 17 as tally marks
100
The name of a graph is called a...
Title
100

How many people chose sausage as their favorite pizza topping?
20.
100

How many students ate 3 candy bars?
3
200
Uses small pictures or symbols to show and compare information.
Picture Graph
200
Show me a vertical bar graph
200
What does 4 lines with a slash through it mean?
5
200

Which color has the greatest number of people who voted for it?
Blue
200
Which number of candy bars has the least amount of students who ate it?
0,1,2, 4 or 7. (answers could vary) whether one says 0,1,2, 7 because they have one or it could be 4 because there aren't any.
300
Shows what or how much each picture or symbol stands for.
Key
300
Show me a horizontal bar graph
300
This uses tallys to record data
Tally table
300
 How many people voted for Life and Corn Flakes as their favorite types of cereal?
10.
300

How many students have no books in their desk?
1.
400
Uses marks or (x) to record each piece of data above a number line.
Line Plot
400
Show me a key for a bar graph of your choice.
400
This uses numbers to record data.
Frequency Table
400

What type of bar graph is this? Which class had the least number of sign-ups?
Horizontal. Archery
400
How many children participated in this survey?
20.
500
Equally space numbers that help you read the number each bar stands for..
Scale
500
Show me a line plot
500
Is it easier to read information from a frequency table or bar graph? Why?
Whichever one works best for you! :)
500

How long can whales hold their breath? Why did they choose a scale of counting by 2's?
19. Answers may vary.
500
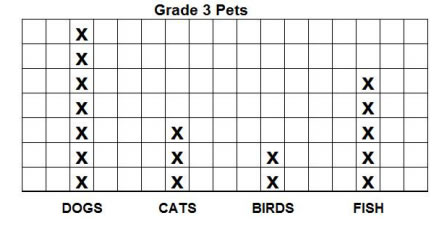
If 3 more children said their pets were cats then how many children would have cats altogether?
6.