All about Graphs
Vocabulary
Reading Graphs
Parts of a Graph
Multiplication Review
100
This type of graph connects dots with a line or curve to show a change in data over time
Line Graph
100
A chart that uses tally's or numbers to record data is called a ______ chart
tally chart or data chart or survey
100
How many 4th graders played basketball this year?
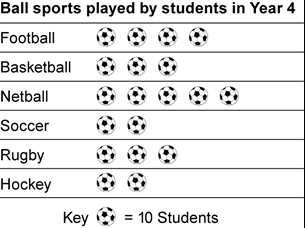
30
100
In this graph, which color m&m's were the MOST common?

green
100
3 X 9 = _______
27
200
Which month did the MOST students have birthdays?

June
200
Information that is collected and represented on a graph is called _______________. (hint: starts with a d)
data
200
IF each x = 1 , how many cars were sold on Sunday? 
3 cars
200
What is this part of a graph called? HINT: it starts with a k .
Key
200
5 X 7 = ________
35
300
Which movie type was the LEAST popular?

Drama
300
This graph uses bars to show data
bar graph
300
What is the difference between the number of students who have cats for pets and the number of students who have goldfish ?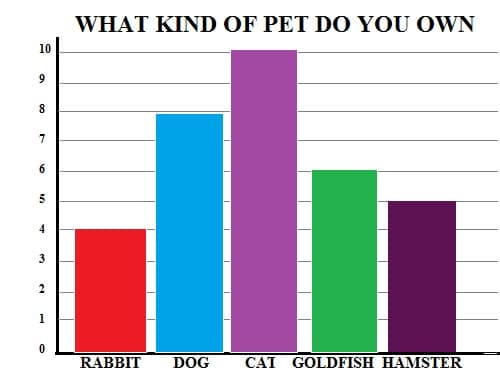
4 more students own cats than own goldfish
300
How many people checked out 6 books? Each x = 1
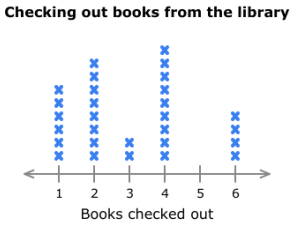
4 people
300
8x6
48
400
Which bakery spent $40?
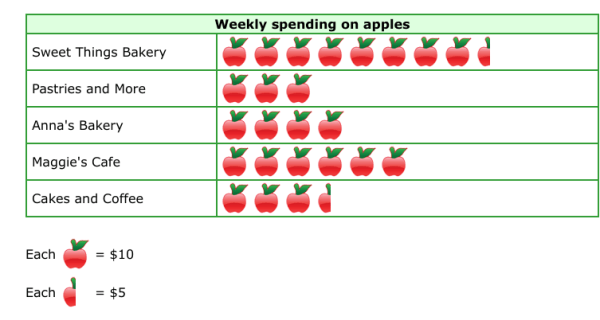
Anna's Bakery
400
This type of graph uses pictures to show data
pictograph or picture graph
400
How many more cupcakes were sold on Friday than on Monday?
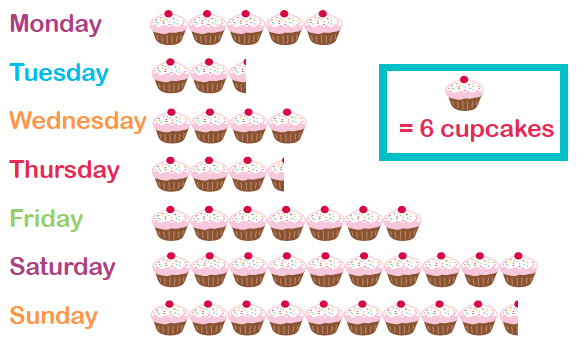
12
400
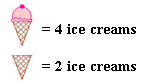
If each bucket = 2 and a half bucket = 1, how many sand castles did Hayley build?
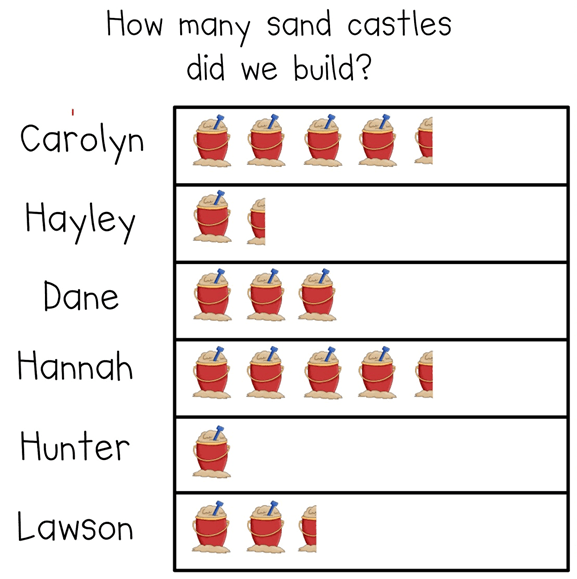
3 sand castles
400
4x7
28
500
What is the RANGE of data?
10-3=7
7 is the range
500
This type of graph uses x's to show data on a line
line plot
500
If 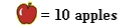
Then what does (half) 
 5 apples
500
How many more red m&m's were there than yellow?
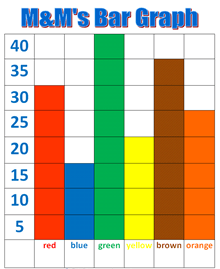
10 more
500
*CHALLENGE*
60 x 6 = ?
360