A
B
100
Does this scatter plot show any association? If yes what kind? Explain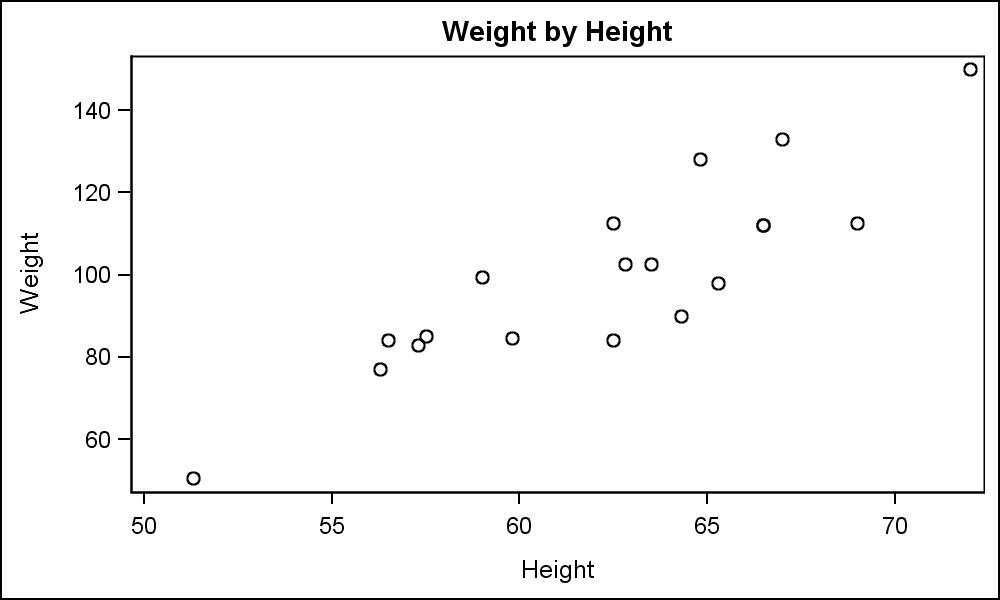
Yes a positive association, as someone's height increase their weight increases.
100
In this scatter plot what kind of association does it have. Explain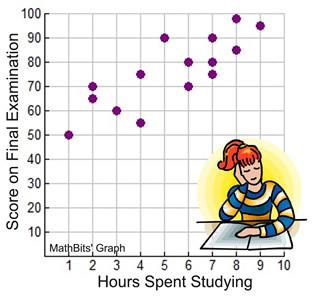
It has a positive association: because as you increase the hours studied the test scores increase.
200
In this scatter plot is there any outliers? if yes where? What is the ordered pair?
Yes about (53,51) 53 inches and 51 pounds
another about (75, 150) 80 inches and 150 pounds
200
In this scatter plot what kind of association does it have? Explain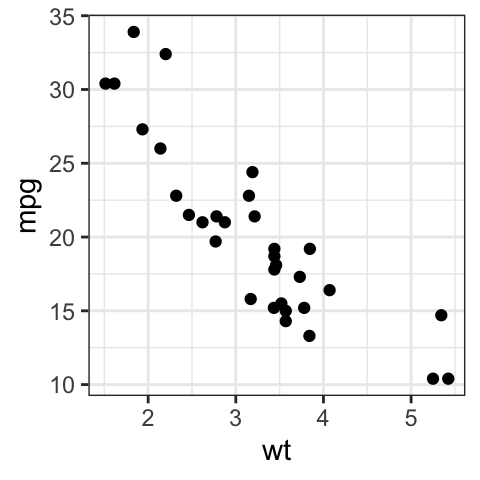
Negative association: as "wt" increases the "mpg" decreases.
300
In this scatter plot is there a gap? If so describe where.
Yes between 53 to 56 inches, 55 to 70 pounds
also between 70 to 79 inches , 115 to 140 pounds
300
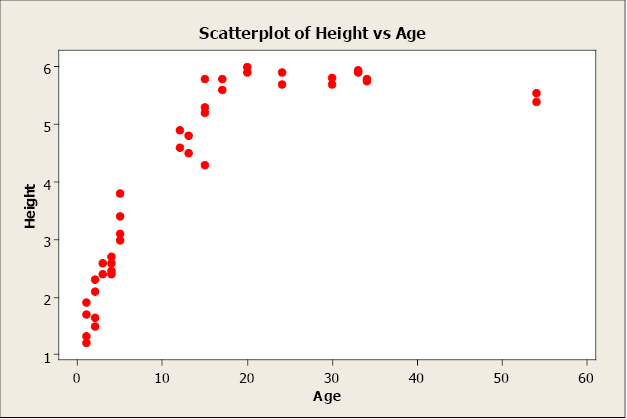
Does this scatter plot have a gap? Outlier? cluster? Explain
Sample answer:
Gap yes between 4 to 5 and 10 to 15
Outlier: No, all the points are close together
Cluster: Yes 2 of them between 0 to 4 and 5 to 6
400
In this scatter plot is there a cluster? If yes describe where.
Yes between 57 to 69 inches, 75 to 135 pounds
400
What are the 6 ordered pairs of this scatter plot? 
Sample answer: about (0, 25), (4.1,25), (5, 30), (6 ,29), (6, 41), (6, 46)
500
In this scatter plot what kind of association does it have. Explain
No association: it is neither increasing or decreasing.
500
Create a scatter plot relating age and height. Label the x and y-axis. Include a cluster, outlier and a gap.
use (age, height) as your ordered pairs.
Sample: