Correlations
(situations & graphs)
(situations & graphs)
What type of correlation/relationship is described below:
Hours of exercise and weight lose
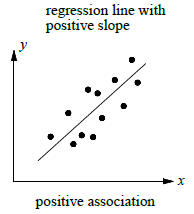
Positive Correlation
Does this line of fit represent the scatter plot accurately? Why or why not?
What is an outlier?
A value in a set of data that is significantly different from the other values.
What is the line of fit
line drawn on a scatter plot that is close to most of the data points.
What college did Miss Niceswanger attend?
Marietta College
What type of correlation/relationship does this graph show?
No Correlation
Does this line of fit represent this data accurately?
What is a cluster in a scatter plot?
Data values that appear to bunch up together in a particular area of the graph.
How many points should you have above the line of fit compared to what you have below it?
the same
How many kids does Ms. Dickerson have?
1
What type of correlation is described below:
Time spent doing homework and number of missing assignments
What is your y-intercept for this line of fit?

(0,9)
What is a gap in a scatter plot?
When points are significantly separate in a scatter plot leaving an empty space.
What type of correlation is represented below?

Negative relationship
What year are you all projected to graduate High School?
May 2030
What type of correlation is shown below?

Negative Correlation
Create a scatter plot that has a strong NEGATIVE correlation.
Chart with points trending downward in a linear direction.
Identify any outliers, clusters, or gaps from the graph below:
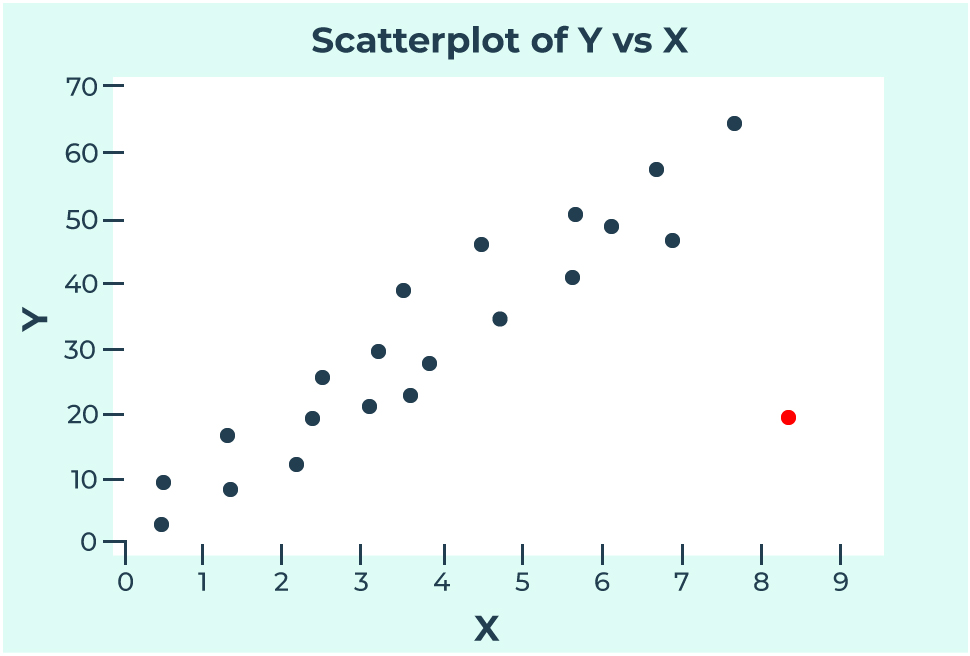
Outlier: (8.5,20)
As the age of a car increases, its value decreases. Which scatterplot best represents this relationship?
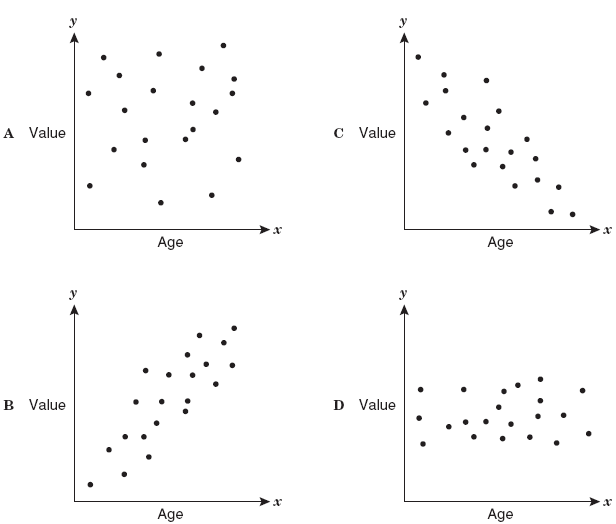
c
What day this LAST year did tik tok get temporarily banned?
January 19th
What type of correlation/relationship is described below?
Number of visitors to a water park and temperature outside
Positive Correlation
Create a scatter plot that has no correlation.
Chart with points in many different places that aren't going in a visible linear direction.
Identify any outliers, clusters, or gaps from the graph below:

Cluster: from (6,85) to (9,85)
Outlier: (17,86)
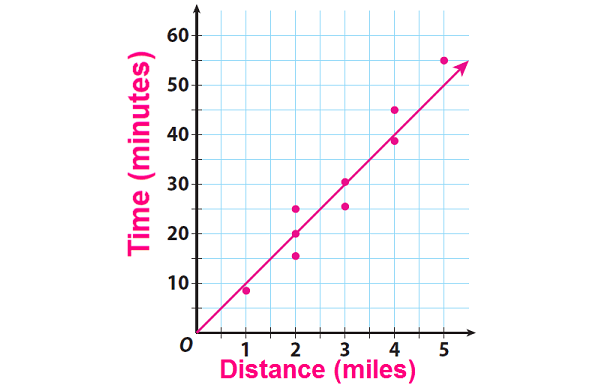
Does this line of fit do a good job representing the data of this scatter plot? Why?
Yes, because the line follows in a linear formation alongside all the points, and it has the same number of points above the line as there are below it.
How old is Miss Niceswanger?
22 years old