Stem and Leaf
Mean, Median, Mode
Range and IQR
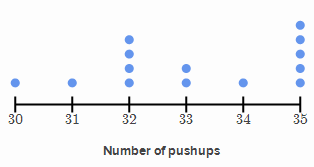
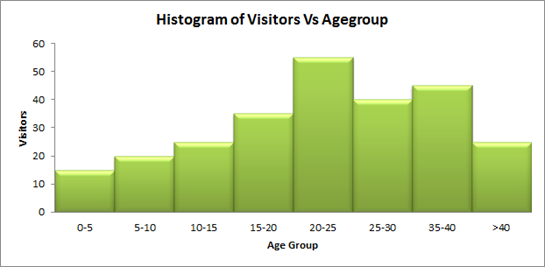
Dot Plots and Histograms
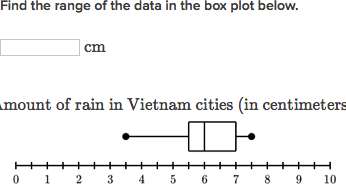
Box and Whisker plots
5
Look at the stem and leaf plot below:
Stem | Leaf
1 | 2 7 8 9
2 | 2 3
3 | 1 5
4 | 0
List the numbers in the stem and leaf plot.
Data: 12, 17, 18, 19, 22, 23, 31, 35, 40
5
What is the mode?
1.06,9.3,59.59,6.01,25.17,1.06,6,1.06,0.7
1.06
5
What is the range?
12, 12, 14, 15, 12, 16, 12, 18
What is 6?
5
What is the mode?
What is 35?
5
What is 4?
10
Stem | Leaf KEY: 2 | 3 = 23
2 | 3 5 5 5 7 8
3 | 6 6
4 | 5
5 | 0
What is the mode?
What is 2.5?
10
What is the median?
7, 8, 16, 11, 9, 13
What is 10?
10
what is the range
33, 4, 5, 6, 10, 15, 17, 18, 19, 21, 29
What is 29?
10
What is the median?
What is 5?
10

What is the median of the data?
What is about 62-64?
25
Stem | Leaf
2 | 1 2 7 8
3 | 2 7 9
4 | 0 7 9
5 | 9 9
Find the mode.
What is 59?
25
What is the median?
7, 12, 10, 12, 16, 10, 14, 1
What is 11?
25
what is the range
29, 34, 39, 43, 73, 91, 198
What is 169?
25

What interval is the mode?
What is 16-20?
25
150, 134, 136, 120, 145, 170, 125, 130, 145, 190, 140
What are Q1 and Q3?
Q1- 130
Q3- 150
50
What is the difference between stem and leaf?
Stem: Leading digits
Leaf: Last digits
50
Whats the mean?
13, 9, 4, 19, 7, 8, 17
What is 11?
50
What is the interquartile range?
35,49,53,69,69,77,84
(Q3-Q1)
What is 28?
50

Which interval has 300 employees?
What is 11-21?
50
What are the five numbers needed to make a box plot for this data?
25, 28, 29, 29, 31, 33, 35, 35, 37, 38
Minimum: 25
Q1: 29
Median: 32
Q3: 35
Maximum: 38
100
Stem | Leaf
1 | 2 3 5 8 9
2 | 0 2 3 9
3 | 2 5 7 8 8 8 9
4 | 2 3 6 9
5 | 0 3 5 8 9
Find the median.
What is 38?
100
What is the mean?
16, 18, 12, 9, 7, 1, 16, 16
ROUND TO THE TENTHS PLACE
What is 11.9?
100
Find the IQR.
30, 45, 50, 65, 72, 78, 89, 92, 97, 100, 100
(Q3-Q1)
What is 47?
100
Is this graph symmetrical or skewed (if skewed, which way)?
Symmetrical
100
What is the five number spread for this data?
10, 8, 9, 7, 10, 12, 14, 14, 16, 10
Minimum- 7
Q1- 9
Q2- 10
Q3- 14
Maximum- 16