Best used to
Mean, Median, Mode
Range and IQR
Displays
Box and Whisker plots
Random
100
When is it best to use a bar graph?
Best used to show the number of items in specific categories
100
What is the mode?
1.06,9.3,59.59,6.01,25.17,1.06,6,1.06,0.7
1.06
100
what is the range
5 10 17 19 35.3 3 4 56 7 1.7
35.3 - 1.7 = 33.6
100
What fraction or percentage of data is in each of the 4 sections of a box and whisker plot.
25%
100
Find the lower extreme
5 10 15 20 25
5
100
Which would you use to describe the spread of the data?
mean absolute deviation
200
When is it best to use a box plot?
Best to use a box plot to show measures of variation for a set of data, also useful for very large sets of data.
200
What is the median?
93, 47, 37, 49, 25, 12, 13, 57
(37 + 47)/2 = 42
200
what is the median
33 4 5 6 10 15 17 18 19 21 29
4 5 6 10 15 17 18 19 21 29 33
17 = med
200
Can you find the mean using a Histogram?
no
200
What is the upper extreme
5 10 15 20 25
25
200
True or False: A peak is similar to the mode.
True
300
When is it best to use a histogram?
Best used to show frequency of data divided into equal intervals.
300
What is the median?
103, 2, 23, 156.5, 105.5, 145
104.25
300
what is the second quartile?
29 34 39 43 73 91 198
91
300
Is it possible to find the median using a frequency table?
no
300
What is the first quartile?
1 2 3 4 4 5 6
2
300
Is there a gap? If so, what is it?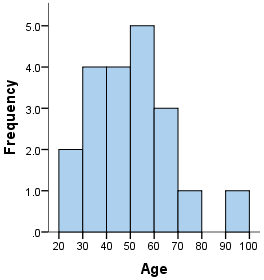
Yes, there is a gap. The gap is between 80-90
400
When is it best to use a line graph?
Best used to show change over a period of time.
400
Whats the mean?
1, 1, 2, 3, 4, 4, 5, 6, 7, 8
41/10 = 4.1
400
Whats quartile 2?
35, 49, 53, 69, 69, 77, 84
77
400
What is the first step you need to do to make a
box plot?
order the data
400
What is Quartile 2?
1 2 3 4 5 6
5
400
What is the peak?

5
500
When is it best to use a line plot?
Best to use to show how many times each number occurs.
500
What is the average grade for a student who's grades are:
13, 27.3, 69, 69, 23, 97.
49.7
500
Find the IQR of the data set.
30, 45, 46, 72, 78, 89, 99, 100, 100
Median = 78
q1 = 45.5
q2 = 99.5
iqr = 99.5-45.5 = 54
500
What are the measures of center that you can find or calculate by looking at a dot-plot?
Mean, Median, Mode, MAD
500
What is the IQR of the data-set
4, 5, 6, 7, 8, 9, 10
4
500
What is another name for a box plot?
Box and whiskers plot