Observation and Inference
Variables
Scientific Method
Analysing Graphs
Drawing Graphs
Separation Techniques
Science Scenarios
Science setups
100
We make observations using our senses. List the 5 senses.
Sight, Hearing, Taste, Touch, Smell
100
Name the 3 types of variables
Independent variable, dependent variable, controlled variable
100
State the missing word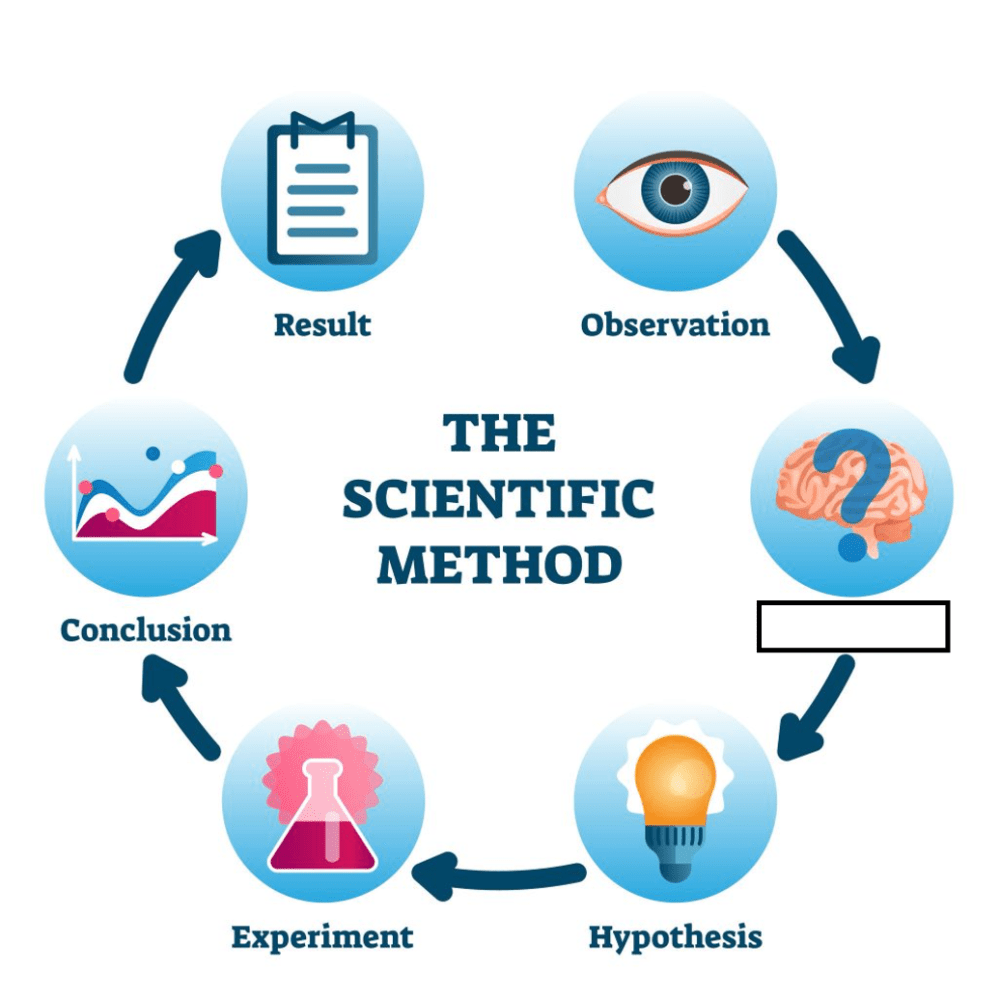
Question
100
Which conclusion can be made from this graph?
a. Green is the favourite colour of 4 children
b. Red is the most popular colour
c. The sample size is 32 students
d. Yellow is the most popular colour
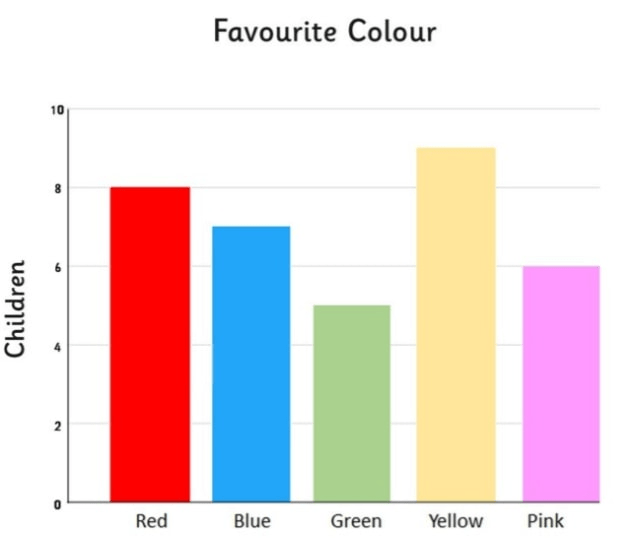
d. Yellow is the most popular colour
100
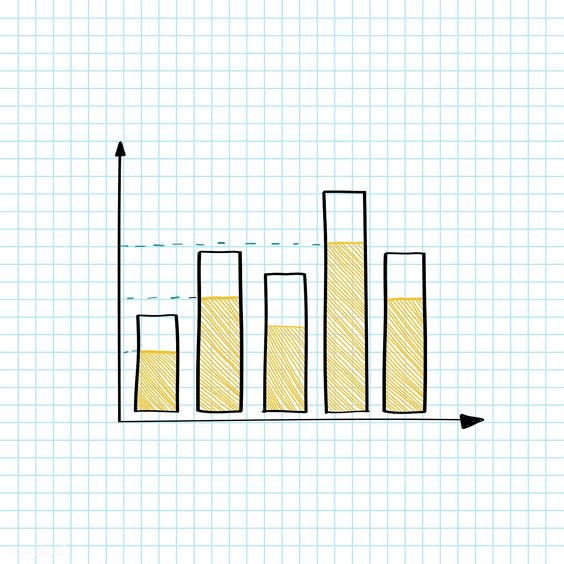
State the feature that is missing in the graph below
Title
100
You’ve got a cup of salty water. What’s the simplest method to separate the salt from the water
evaporation
100
Bella gives her plants different amounts of water each week and records how tall they grow.What is the independent variable?
amount of water
100
What part of a science report explains what you're trying to find out?
the aim
200
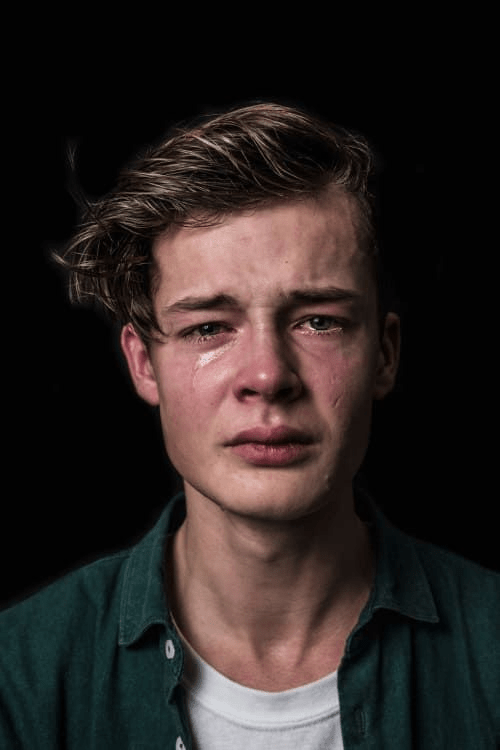
Make one observation about this picture:
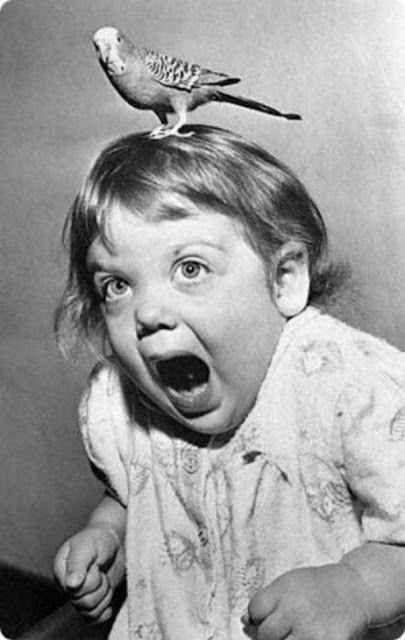
Any correct. e.g. a bird sits on the girl's head, the girl's mouth is open, etc.
200
The type of variable kept the same to ensure a fair test is:
a. Independent variable
b. Dependent variable
c. Controlled variable
d. Constant variable
c. Controlled variable
200
An educated guess about what will happen in an experiment is called:
a. Aim
b. Conclusion
c. Hypothesis
d. Title
c. Hypothesis
200
Name this type of graph and state one conclusion that can be made from it
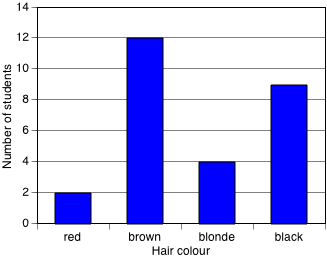
Column graph
Any acceptable conclusion. e.g. Brown hair is the most common hair type, 9 students have black hair, red hair is least common, etc.
200
What type of graph should be drawn from the below data?
a. Column
b. Line
c. Scatter plot
d. Pie graph
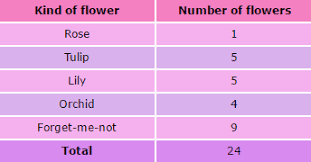
a. Column
200
What separation technique uses heat to form high quality, solid crystals from a solution
crystallisation
200
Bella gives her plants different amounts of water each week and records how tall they grow, what is the dependent variable?
the plant height
200
Which part of a science report lists all the equipment you need?
the materials list
300
The person stubbed his toe. Is an:
a. Observation
b. Inference
b. Inference
300
The variable you change on purpose is called the:
a. Independent variable
b. Dependent variable
c. Controlled variable
d. Changed variable
a. Independent variable
300
At the end of our experiment, we analyse our results and answer the question in the aim. This is called:
a. Hypothesis
b. Conclusion
c. Graph
d. Table
b. Conclusion
300
Identify the correct statement that can be made from the graph
a. 100 books were sold in week 7
b. More books were sold in week 6 than week 5
c. Twice as many books were sold in week 2 than week 1
d. Week 1 had the least book sales
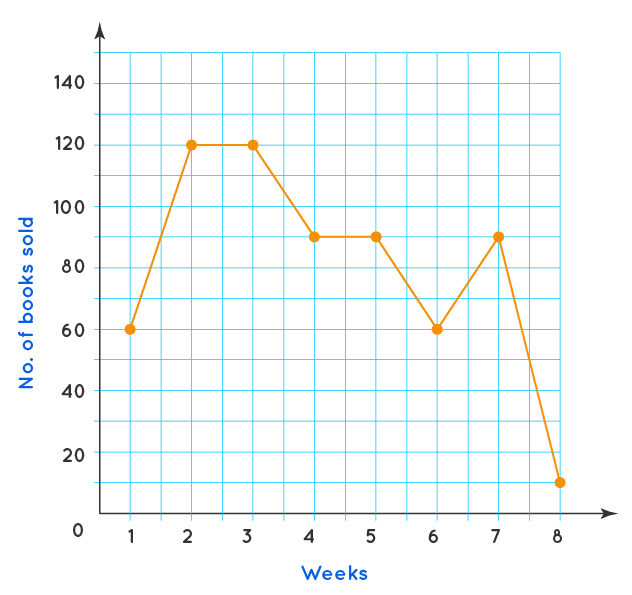
c. Twice as many books were sold in week 2 than week 1
300
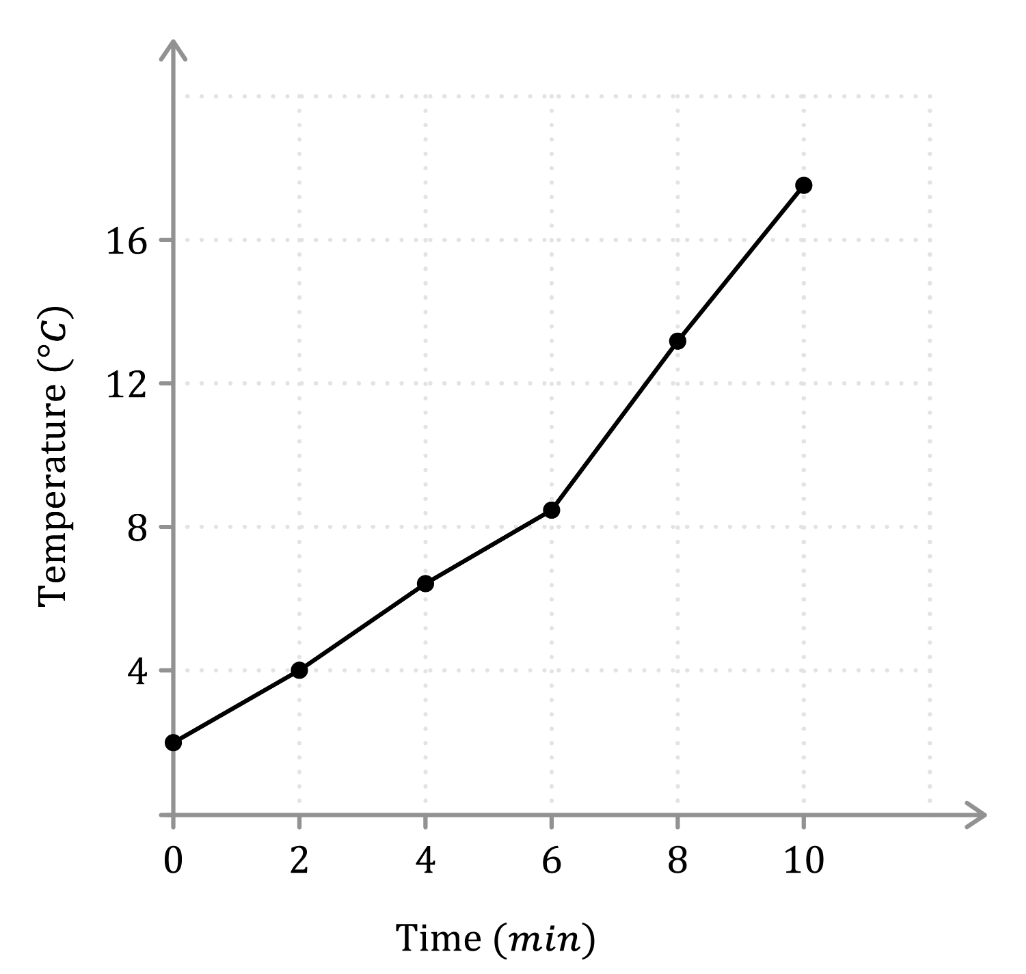
Name 3 features this graph is missing
Any 3:
Title
Labels
Units
Scale
300
You’re given a mix of sand and water. Which method should you use to separate the sand
filtration
300
Jamie tests how the type of exercise (running, walking, dancing) affects heart rate.
State a hypothesis for this experiment.
If the type of exercise changes, then the heart rate will also change.
300
Which of these is the best method step?
A) We heated some water.
B) We heated 100 mL of water in a beaker.
C) We put some water in a container.
D) We heated water until it was warm.
B) We heated 100 mL of water in a beaker
400
Make one observation about the picture.
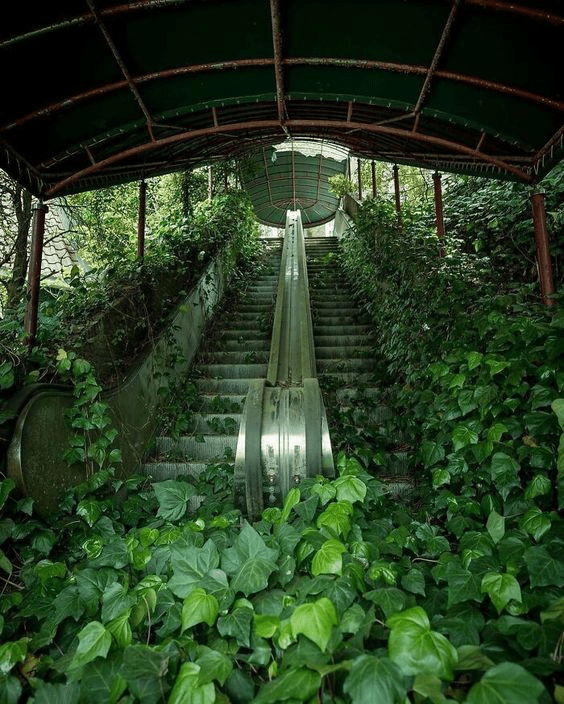
Any correct, e.g:
Observation: Plants are growing over the escalator
400
Name the variable that we measure of observe
Dependent variable
400
"To investigate the effect of wing length on the distance a paper plane flys"
This is a:
a. Hypothesis
b. Conclusion
c. Observation
d. Aim
d. Aim
400
Use the graph below to identify the independent and dependent variables in the experiment:

Independent variable: Time (hr)
Dependent variable: Distance (Km)
400
Give an appropriate title for the below graph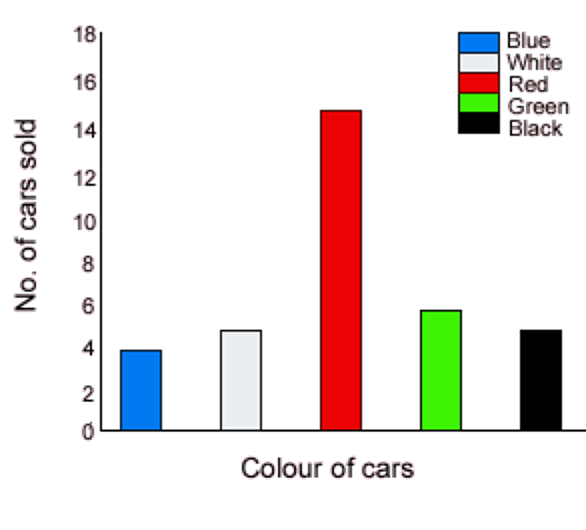
Must contain independent and dependent variables. E.g. effect of car colour on number of cars sold or number of cars sold by car colour
400
You need to separate the dyes in black ink. What method do you use?
chromatography
400
Sam wants to know if sunlight affects how fast ice melts. She puts one ice cube in the sun and one in the shade and times how long each takes to melt.
What is the dependent variable?
time taken for the ice to melt
400
You did an experiment testing how different amounts of sunlight affect plant growth.
What would be a good aim for your experiment?
To investigate the effect of sunlight on plant growth.
500
A student writes: “The liquid got hotter and looked bubbly.”
Your task:
Identify one qualitative and one quantitative observation that would improve this sentence.
Qualitative: The liquid produced large bubbles and changed from clear to cloudy.
Quantitative: The temperature increased from 24°C to 89°C over 5 minutes.
500
Tim conducted an experiment to investigate if the car shape affects the speed it can travel. Identify the independent variable, dependent variable and two controlled variables for this experiment.
Independent variable: car shape
Dependent variable: speed
Controlled: any two appropriate. E.g. same car colour, same distance car travels, same mass of car, etc.
500
When we conduct an experiment we collect data. List the two ways we normally present this data.
In a table and graph
500
Name this type of graph and the name of the line
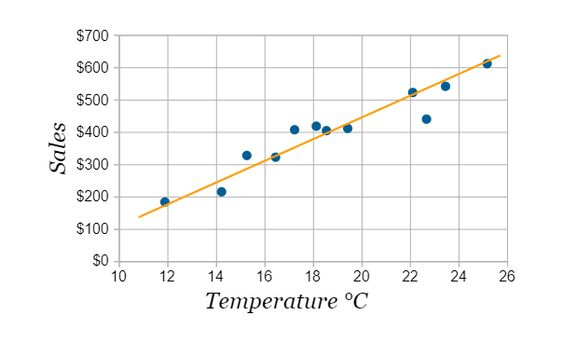
Graph: Scatter plot
Line: Line of best fit
500
State the type of graph you would draw for the below data and identify the variable you would place on the x-axis (horizontal) and the y-axis (vertical).
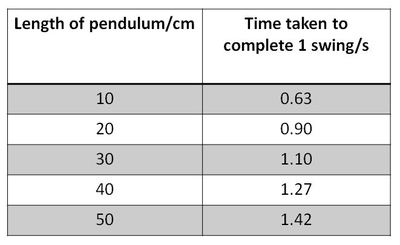
Type of Graph: Line
X axis: Length of pendulum
Y axis: Time taken to complete 1 swing
500
A teacher mixes Styrofoam balls, sand, and sugar. You need three separate bowls with each ingredient. Name three separation methods you'd use (one for each)
sieving (Styrofoam), filtration (sand), and evaporation/crystallisation (sugar)
500
A student sets up 5 pots of the same plant. Each pot is placed in a different coloured light (red, blue, green, white, and no light). The height of the plant is measured weekly for 2 months.
What is the independent variable and dependent variable?
IV: The colour of light
DV: The height of the plant
500
You’re writing up an experiment and want to make your method better. Rewrite this step:
"We measured some water and heated it for a bit."
We measured 100 mL of water using a measuring cylinder and heated it in a 250 mL beaker until it reached 60°C