Vocabulary Part 1
Vocabulary Part 2
Likelihoods & Probability
Mean, Median, Mode and MAD
Population and Samples
100
The number that appears the most often in a data set
Mode
100
The likelihood of an event happening, expressed as a fraction, decimal, or percent
Probabilty
100
The probability of spinning green

¼, 0.25, or 25%
100
The mode of the data set:
{4, 5, 5, 8, 15, 23}
5
100
A part of a population
Sample
200
The middle number in a data set
Median
200
The likelihood of an event when the event will definitely happen; 100% probability
Certain
200
The likelihood of spinning green
unlikely
200
The median of the data set:
{4, 5, 5, 8, 15, 23}
6.5
200
The type of sample: asking people attending a baseball game what their favorite sport is
biased sample
300
The average of the values in a data set
Mean
300
The likelihood of an event when the event will definitely not happen; 0% probability
Impossible
300
The probability of flipping a coin and having it land on heads
½, 0.5, 50%
300
The mean of the data set:
{4, 5, 5, 8, 15, 23}
10
300
The type of sample: asking every 5th kid entering the cafeteria what their favorite dessert is
Random Sample
400
The difference between the highest and lowest values within that set
Range
400
An experiment that uses a stand-in model to represent a real-world situation (ex. spinning a spinner, flipping a coin)
Simulation
400
12 people who have taken their seats at a seminar, 2 have red hair.
What is the probability that the next person to take a seat will have red hair, in fraction form?
2/12 or 1/6
400
The Range of the data set
{4, 5, 5, 8, 15, 23}
19
400
Which graph shows a symmetrical relationship with the data?
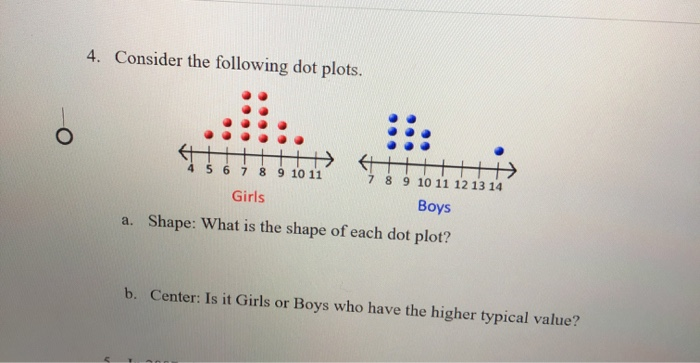
Girls
500
The average distance between each data value and the mean
Mean Absolute Deviation (MAD)
500
3 visual models used to represent all possible outcomes of a compound event
list, tree diagram, and table
500
The number of unique ways of ordering ice cream given 3 flavor choices, 4 toppings choices, and the choice of cone or dish
24
500
The MAD of the data set if the mean is 10
{4, 5, 5, 8, 15, 23}
6
500
3 out of 10 students surveyed said they have both a dog and a cat. If the population of the school is 720, what is the predicted number of students who have both a dog and a cat in the school
216 students