Vocabulary
Association
Predictions
Linear or Non-Linear
Interpret Line of best fit
100
What is the term used for a piece of data that does not fit with the rest of the data?
What is outlier
100
Determine the association shown in the scatter plot below.

What is a positive linear association
100
Make a prediction for the altitude of the balloon at 2 minutes.

What is 434 ft
Acceptable: 430-440
100
What is the difference between a linear and non-linear correlation?
Linear- data tends to show a straight pattern
non-linear- data tends to show a curvy pattern
100
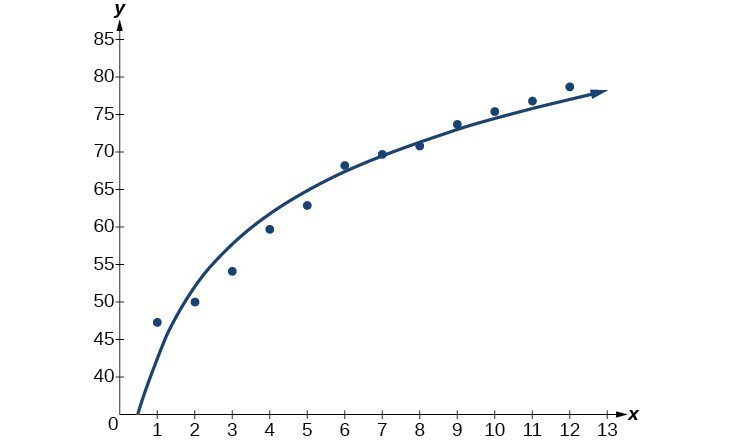
see picture 1.
Using the graph, predict the height of a person whose arm span is 200 cm
The height would be 200 cm
200
What is the term for a scatterplot who's data has no pattern or predictability?
What is no association
200
Determine the association in the scatter plot below.

What is no association
200
What is the y-intercept according to the line of best fit and what does it mean in the context of how test scores are related to the number of hours studied?

What is (0, 60). This shows that a student who doesn't study will most likely get a score close to 60.
200
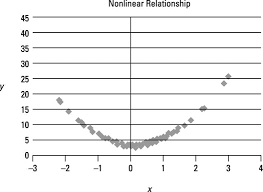
True or false: This is a nonlinear correlation.
True.
200
The line of best fit is given by the equation: 𝑦=−1.3𝑥+17.5 where the 𝑥 variable represents the age of a tadpole and the 𝑦 represents the length of the tadpole.
Predict the tail length of a tadpole whose age is 12 days using the line of best fit given.
𝑦=−1.3𝑥+17.5=−1.3(12)+17.5=1.9
We predict that the tadpole's tail would be 1.9 mm.
300
What is the term for a line on a scatter plot, drawn near the points that approximate the association between the data sets?
What is the line of best fit
300
Determine the association of the scatter plot below.

What is nonlinear
300
Make a prediction for the volume of the tank at 12 minutes.

What is 270 gal?
Accepted 250-290
300
Is there a linear or nonlinear correlation?
There is a linear correlation.
300
The line of best fit is given by the equation: 𝑦=0.95𝑥+9.4 where x is arm span and y is the height.
Predict the height of a person whose arm span is 190 cm, using the line of best fit given.
y=0.95(190)+9.4=189.9 cm
400
What is the difference between strong and weak association?
What is strong association means there is a more predictable pattern and that the data points are closer together. Weak association has a less noticeable pattern and more spread out data points.
400
Determine the full association of the scatter plot.
What is weak negative linear
400
Make an estimate for the slope in this situation based on the line of best fit. What does it show?
What is -20/5 or -4. This shows that every min the temperature is decreasing on average by 4 degrees.
400
Describe this relationship.

A strong linear relationship.
400
see picture 1.
Interpret the slope in context using this form.
For every_______________the predicted __________ INCREASES/DECREASES by______________
for every 1 cm the arm span grows, the predicted height increases by 0.95 cm
500
see picture 2
Are there any clusters or outliers? If so, where?
1 outlier: (8,40)
1 cluster: from 8-9.5 hours
500
Determine the full association for the scatter plot below.

What is no correlation
500
Given points on the graph, (0,453) and (10, 359), and what is the slope for the equation of the line of best fit?

What is 94/10 = -9.4. This means that for every minute that passes the elevation decreases by 9.4 ft.
500
Which of these scatter plots is linear?
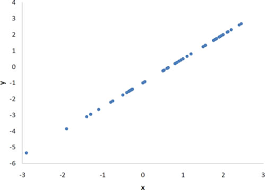
The second scatter plot.
500
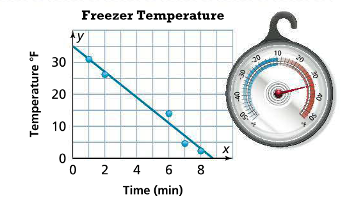
see pic 3
The equation of the line of best fit is y=-4x+35. Interpret the slope of the line using this format.
For every_______________the predicted __________ INCREASES/DECREASES by______________
For every 1 minute, the predicted temperature decreases by 4 degrees farenheit