Scatter Plots
Mean, Median, Mode, Range
Dot Plots
Stem and Leaf Plots
Histograms and Bar Graphs
100
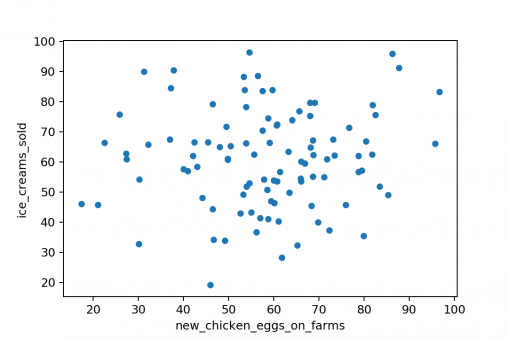
Does this scatter plot show positive correlation, no correlation, or negative correlation?
Positive Correlation
100
Find the mean, median, mode, and range of the following numbers:
10, 4, 6, 10, 5
Mean: 7
Median: 6
Mode: 10
Range: 6
100

What is the mode?
84
100
What is the mode?
36
100

What age range is the mode of the data set?
61-70
200

Does this show positive correlation, negative correlation, or no correlation?
Negative correlation
200
Find the mean, median, mode, and range of the following numbers:
16, 12, 11, 19, 12
Mean: 14
Median: 12
Mode: 12
Range: 7
200

a) How many people are sampled?
b) What is the outlier?
a) 19
b) 11
200
What is the range?
38
200
:max_bytes(150000):strip_icc()/Histogram1-92513160f945482e95c1afc81cb5901e.png)
How many people are represented in this histogram?
51
300
Does this show positive correlation, negative correlation, or no correlation?
No correlation
300
Find the mean, median, mode, and range of the following numbers:
6, 10, 12, 5, 6, 7, 3
Mean: 7
Median: 6
Mode: 6
Range: 9
300
What is the median?
2
300
What is the mean?
(calculator is ok)
33.08
300

What is the mean, median, mode, and range of the number of pants owned?
Mean: 6
Median: 5.5
Mode: 3
Range: 7
400
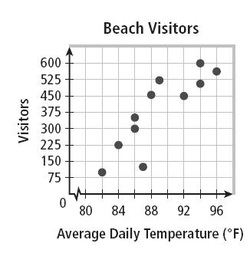
What does this graph show happens to visitors as the weather increases?
The number of visitors increases
400
Find the mean, median, mode, and range of the following numbers:
17, 14, 18, 12, 9, 11, 14, 9
Mean: 13
Median: 13
Mode: 9, 14
Range: 9
400

What is the mean?
2
400
What is the median?
80
400

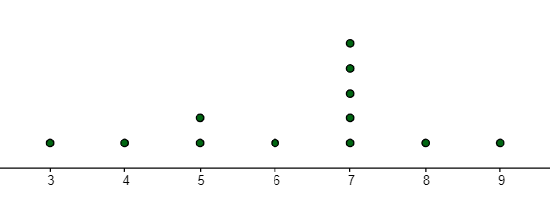
What is the mean, median, mode and range?
Mean: 5
Median: 5.5
Mode: 7
Range: 5
500
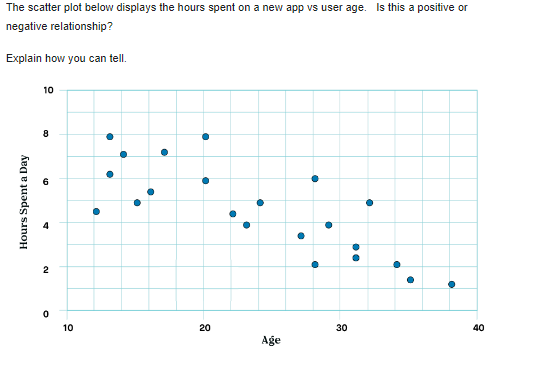
According to the scatter plot, what happens to the number of hours spent on a new app as age increases?
The number of hours spent on the app goes down. They spend less time on the new app.
500
Find the mean, median, mode, and range of the following numbers:
NO CALCULATOR
10, 4, 3, 13, 7, 4, 8, 10, 4
Mean: 7
Median: 7
Mode: 4
Range: 10
500
What is the mean, median, mode, and range?
(calculator is ok)
Mean: 6.25
Median: 7
Mode: 7
Range: 6
500
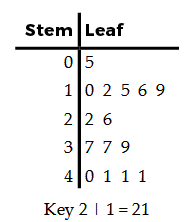
What is the mean, median, mode, and range?
Mean: 26.73
Median: 26
Mode: 41
Range: 36
500
What is the mean, median, mode, and range?
Mean: 3.33
Median: 3
Mode: 3
Range: 5