Relations and Functions
Domain and Range
Linear Functions
Arithmetic Sequences
Scatterplots and Trend Lines
100
What is the difference between a Discrete and continuous graph? Draw an example of each
*See Drawings*
Discrete = Dots
Continous = Lines
100
What is the domain of the following set of ordered pairs?
{(2, 1) (-1, 0) (-1, 3) (0, 2) (-5, 1)}
{-5, -1, 0, 2}
100
What does the graph of a linear function look like?
Straight line
100
State the next 3 terms of the following sequence:
15, 11, 7, 3, ...
-1, -5, -9
100
Which letter is assigned to the correlation coefficient?
r
200
Method for determining if a graph is a function or not
Vertical Line Test
200
What is the range of the following set of ordered pairs?
{(2, 1) (-1, 0) (-1, 3) (0, 2) (-5, 1)}
{0, 1, 2, 3}
200
Name the 3 forms of linear equations and their basic forms
Slope-int
y = mx + b
Point-slope
y-y1 = m(x-x1)
Standard
Ax + By = C
200
Find the 64th term of the following sequence:
5, 8, 11, 14, ...
194
200
Draw a scatterplot that has the given r-value:
r = -0.87
*See Scatterplots*
300
This graph is not a function.

Graph 1
300
Identify the Domain of the following graph (use alligators)
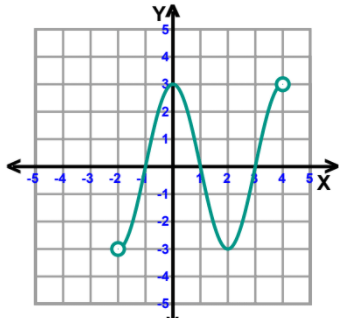
-2<=x<=4
300
Does the table depict a linear or non-linear function?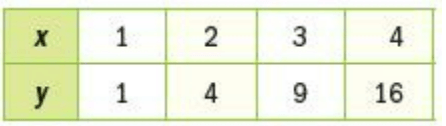
Non-Linear
300
Find the 143rd term of the following sequence:
31, 20, 9, -1, ...
-1531
300
Estimate the r-value of the following scatterplot

0.4 <=r<=0.7
400
{(-1, 3), (0, 2), (1, 1), (2, 0), (0, 3)}
Does this set of ordered pairs represent a function?
NO
400
Identify the Range of the following graph (use alligators)
-3<=y<=3
400
Determine the linear equation in slope-intercept form from the table below
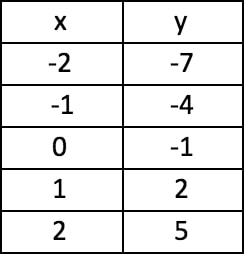
y = 3x - 1
400
State the next 3 terms in the following sequence:
1, 1, 2, 3, 5, 8, 13, ...
21, 34, 55
(This is the Fibonacci Sequence)
400
The trend line equation below relates the amount of hours spent on your phone (x) and its current battery % (y).
y = -8.53x + 100
Estimate the battery% of the phone after 4 hours of use
~65.88%
500
List the following relation as a table, graph, and mapping diagram. Determine if the relation is a function
{(1, 4), (2, 3), (2, -1), (3, 1)}
*See answers*
NOT a function
500
List the Domain AND Range of the following function
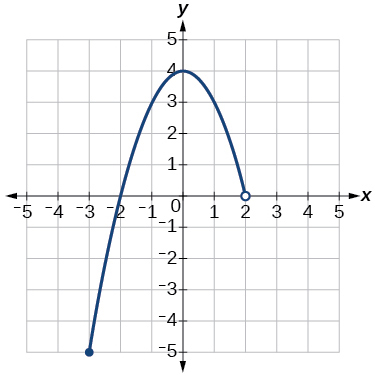
D:
-3 <=x<=2
R:
-5<=y<=4
500
Write the equation of the line that passes through points (8, 12) and (9, 14)
y = 2x - 4
500
Find the value the following non-arithmetic sequence approaches, but never gets bigger than if it were repeated an infinite amount of times:
1/2, 2/3, 3/4, 4/5, 5/6, ...
1
500
ALL GROUPS ATTEMPT
Below is a data table relating the number of years somone has worked on a company and their average salary.
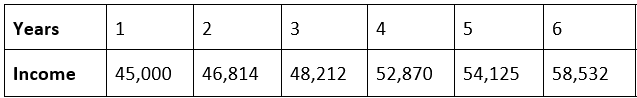
Calculate the trend line equaiton, corellatoin coefficient, and predict the empoyees salary after 10 years
y = 2692.89x + 41500.39
r = 0.9833
Salary after 10 years = 68,429.29