Mean, Median, Mode, Range
Circle Graphs/Bar/Compare
Box Plots and IQR
Fill in the Blank
Random
100
How do you find the range of a data set?
Subtract the lowest from the highest
100
True or False. There are more Year 8 students than Year 7. 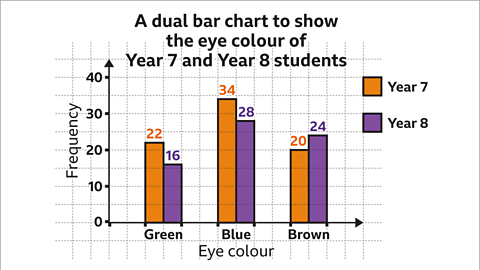
False
100
What 5 values are included in a box plot?
Minimum, Q1, Median, Q3, Maximum
100
To find the mean, you add up all of the numbers and divide by ______
The amount of numbers you added
100
What does the second letter in PEMDAS stand for?
Exponents
200
What is the median?
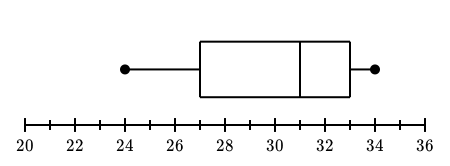
31
200
If there are 450 minutes in a day, how many minutes are spent in math class?

108 minutes
200
A 70 is considered passing. What percent of students did not pass the quiz?
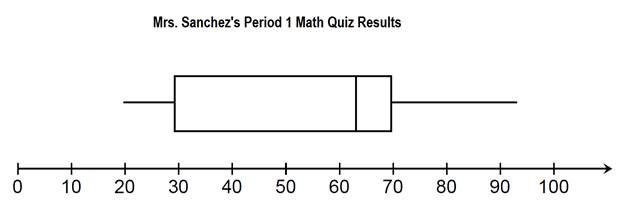
75%
200
In a percent bar, the bar ranges from ____% to _____%
0 to 100
200
Name 3 Justin Bieber songs
Answers will vary
300
What is the median?
8, 44, 106, 87, 9, 27
35.5
300
Which two subjects account for 40% of the data?
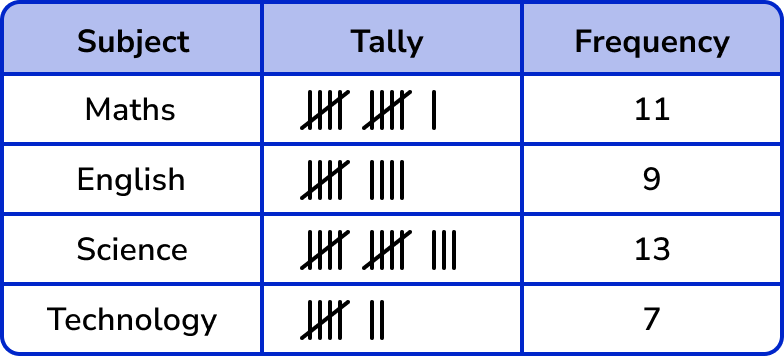
English and Technology
300
What is the difference in ranges between the two classes?
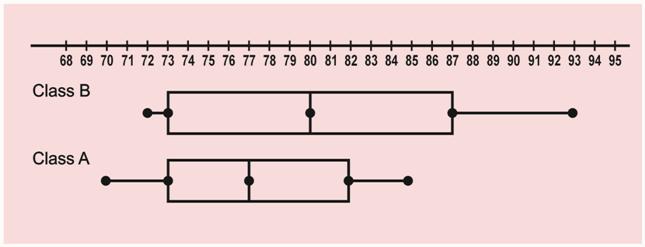
6
300
Each portion of a box plot represents _____ % of the data
25%
300
Who was the first president?
George Washington
400
20% of the data occurs at what interval?

9.14-9.16
400
Which color has the higher mean?
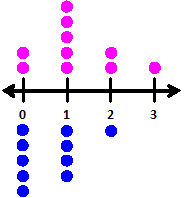
Pink
400
What is the IQR?
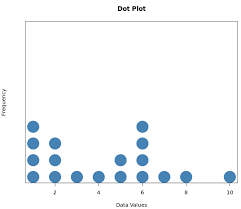
4
400
To find the IQR, you must find:
1. The ______
2. Then you find ______
3. Next you find ______
4. Finally you _______
1. Median
2. Q1
3. Q3
4. Subtract
400
Name 3 Beyonce songs
Answers will vary
500
Create a data set that has the same median and mean (worth 700).
Answers will vary.
500
Which is higher, the median or the mean?

The Mean
500
What is the Interquartile Range?
18
500
What does IQR stand for?
Interquartile Range
500
Name the states that border Texas
Arkansas, Louisiana, Oklahoma, New Mexico