Data Collection
Statistics
Measures of center
Graphs
Histograms
100
What is the most effective way to gather student opinions about the school dance theme?
a. Ask students what they wore to the last dance
b. Survey students on their favorite music genres
c. Check how many students attended previous dances
d. Have students vote on a list of possible themes
What is Have students vote on a list of possible themes?
100
Sarah has the following test scores in science: 85, 90, 78, and 92. If she scores an 85 on her fifth test, which statement is true?
a. The mean increases
b. The mean decreases
c. The mean stays the same
d. The median is 84
What is the mean decreases
100
What is the mean balance point for this data?
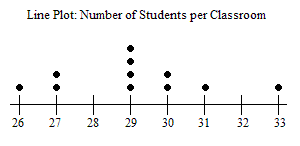
What is 29.1
100
What percent of students like horror, foreign, and comedy?
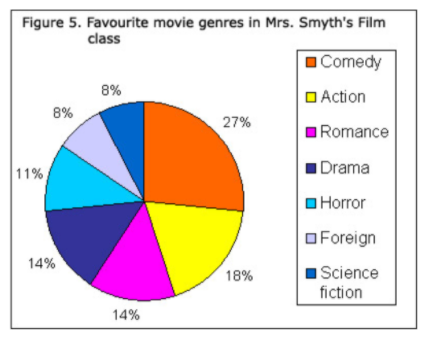
What is 46%
100
Which of the following data sets is most suitable for representation in a histogram?
a. the choice of art mediums by art students
b. the daily number of visitors to a museum
c. the responses to yes/ no questions on environmental awareness
d. the eye color of students in a classroom
What is the daily number of visitors to a museum
200
Which method of collecting data about favorite sports among 6th graders would be most representative?
a. Ask five students in the school cafeteria
b. Survey all students in Ms. Johnson's homeroom class
c. Conduct a random survey of 6th-grade students across all classes
d. Look up "most popular sports for teens" on a search engine
What is Conduct a random survey of 6th-grade students across all classes
200
A class recorded their test scores as follows: 85, 92, 78, 88, 85, 90, 78, 92. If the last score (92) is changed to 85, what will happen to the mode?
a. The mode will increase
b. The mode will decrease
c. The mode will not change
d. There will be no mode
What is the mode will decrease
200
What is the mean balance point for this data?
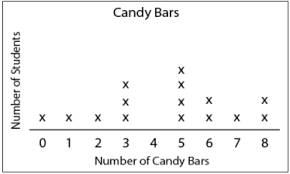
What is 4.8
200
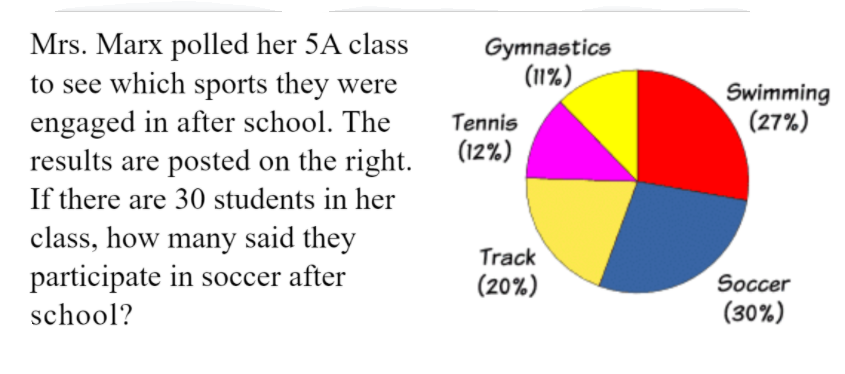
What percentage of students like soccer?
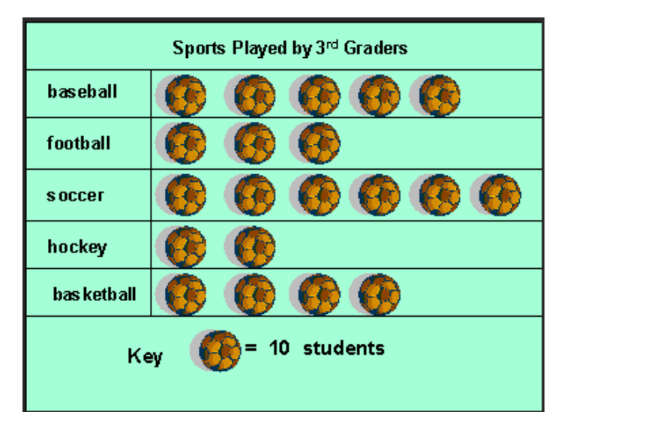
What is 30%
200
What is a common method for collecting data to be displayed in a histogram?
a. online polls
b. case studies
c. experiments
d. all of the above
What is all of the above
300
A physical education teacher wants to improve student participation in gym class. Which data collection method would be most helpful?
a. Measuring students' physical fitness levels
b. Surveying students about their favorite and least favorite activities
c. Observing other schools' PE classes
d. Reviewing academic performance in other subjects
What is Surveying students about their favorite and least favorite activities
300
Sarah's test scores in English are 91, 88, 95, 82, and 89. If her teacher drops the lowest score, what would be the new median?
a. 89
b. 90
c. 91
d. 92
What is 90
300
Rupert has the following scores on his math test:
90, 95, 88, 79.
Which of the following is true if Rupert scores an 88 on his next test?
a.) The mean increases b.) The mode is 88
c.) The mean decreases d.) The median increases
What is the mode is 88
300
What percent of students scored at least a 45?
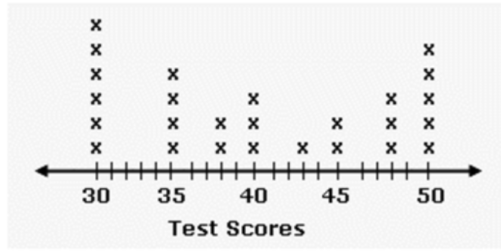
What is 38%
300
A survey is conducted to create a histogram. What type of question should the survey include?
a. essay questions
b. quantity questions
c. yes or no questions
d. questions about preferences
What is quantity questions
400
Which method would provide the most useful data to improve the school lunch menu?
a. Analyzing the nutritional content of current meals
b. Observing how much food is wasted each day
c. Surveying students about their food preferences
d. Consulting with a professional nutritionist
What is surveying students about their food preferences
400
What is the range?
5, 7, 2, 5, 2
What is 5?
400
The skating rink listed the number of middle schoolers that go on Friday night.
10, 12, 12, 13, 11, 14, 13, 15
What would happen to the mean, median and mode if the 15 were removed from the data set?
What is..
Mean- Decrease
Median- Decrease
Mode- Same
400
According to the circle graph, what percent of students have dogs..
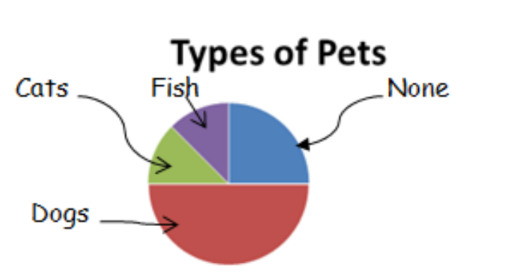
What is 50%
400
Consider a scenario where a city council wants to gather opinions from its residents about a new park design. A survey was conducted.
Why might it be important for the city council to use random sampling when selecting residents to participate in the survey?
a. It prevents personal bias in selecting the sample.
b. It involves the entire population.
c. It requires less time than other methods.
d. It ensures the sample size is large enough.
What is it prevents personal bias in selecting the sample?
500
A school wants to know students' favorite lunch options. What's the best way to get a representative sample?
a. Survey only the student council members
b. Ask teachers about their observations
c. Randomly select students from each grade level
d. Poll students who volunteer to participate
What is randomly select students from each grade level
500
Heather left a bucket outside her back door and measured the depth of the rainwater collected each day. She reported to her science teacher that in 5 days the water levels were:
2 inches, 4 inches, 5 inches, 6 inches, 5 inches.
What is the range?
What is 4 inches?
500
What is mean?
What is median?
What is mode?
What is an outlier?
Mean is the average.
Median is the middle value.
Mode is the value(s) the occur most frequently.
An outlier is a value that lies outside of the other values. (very small or larger)
500
What is 9?
500
In a survey, students were asked to choose their favorite food from a list of options. Each student could choose only one food item.
Which graph type would be best to represent the survey results showing the popularity of each food item?
a. Dot plot
b. Circle Graph
c. Histogram
d. Stem-and-Leaf Plot
What is circle graph