Uni
Bi
What are the Odds?
Look at this Graph
Hyp Me Up
100
It's the mode of this data set:
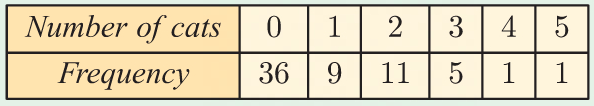
What is 0?
100
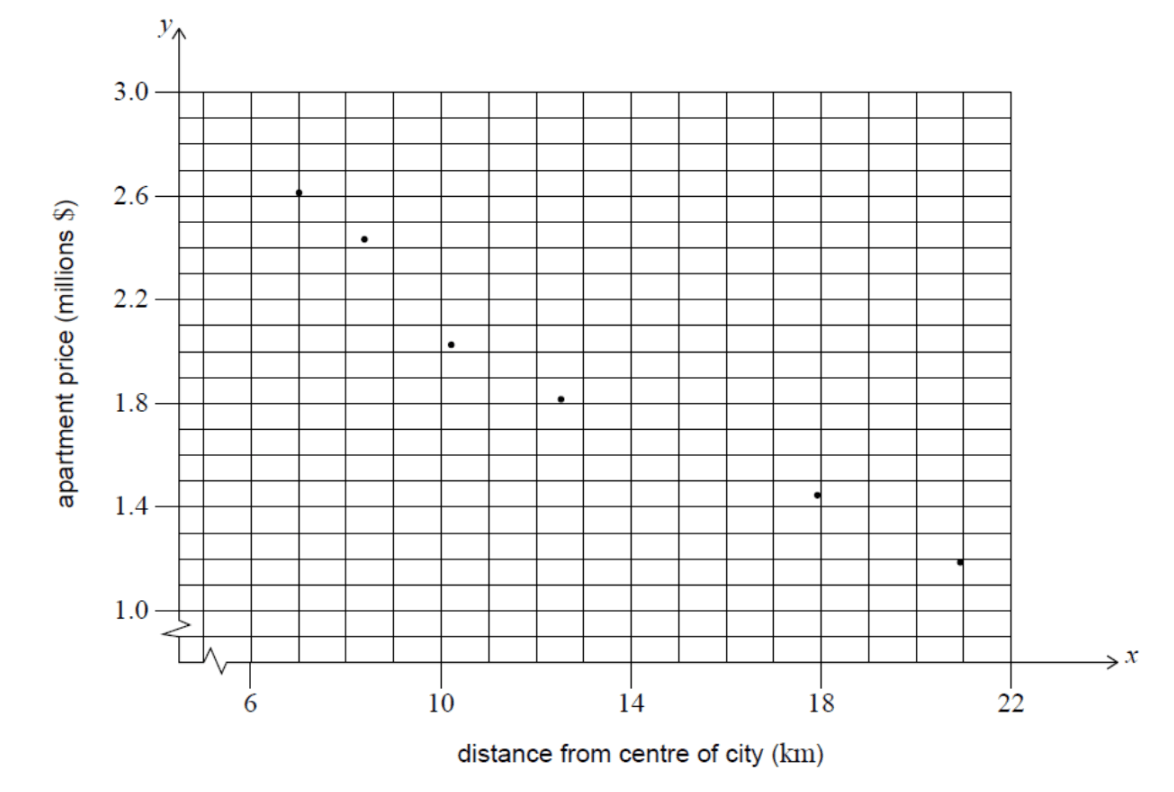
For the following scatter plot, a description of the correlation's direction, linearity, and strength (in that order).
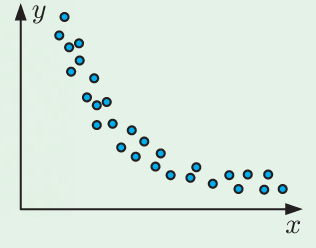
What is negative, non-linear, and strong
100
The odds of two mutually exclusive events happening at the same time.
What is 0?
100
The box and whisker diagram represents points scored by a basketball team in a season. This number gives the median number of points scored.
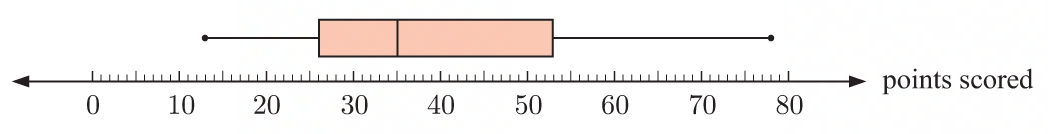
What is 35 points?
100
This test compares the means of two variables using a sample of each.
What is a two sample t-test?
200
In 3 sig figs, it's the mean of this data set:
0, 2, 3, 3, 4, 5, 5, 6, 6, 7, 7, 8
What is 4.67?
200
Pearson's product (to 3 sig figs) for temperature and number of customers at a garden center, given the data below.
What is 0.314?
200
P(C)+P(C')
What is 1?
200
The box plots compare the times students in Years 9 and 12 spend on homework.
These are the times between which the top 25% of Year 9 students spent doing homework.
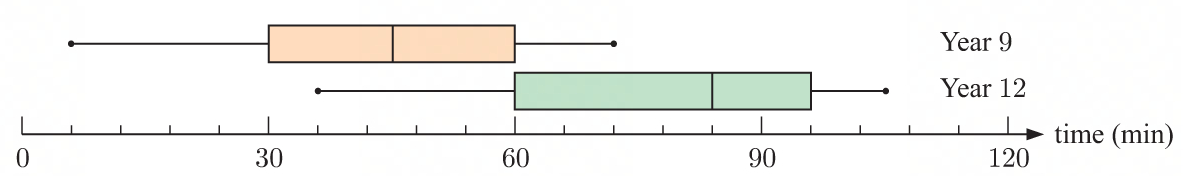
What are 60 and 72 min?
200
The hypotheses for a chi squared test for independence.
What are:
Null: variables are independent
Alternative: variables are dependent
300
It's the standard deviation of the data set (in 3 sig figs):
120, 118, 132, 127, 135, 116, 122, 93, 128
What is 11.7?
300
The regression line for the data in the table below is given by this equation.
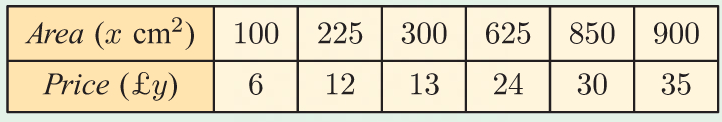
What is
y=0.0335x+3.27
300
X represents the number of questions answered correctly on a 15 question quiz. Each question has 4 choices and 1 correct choice. X~B(15, .25)
This number represents the odds of getting 100% on the quiz
What is 0.000000000931 or 0.0000000931%
300
Given the cumulative frequency graph representing test scores, this score number the median score.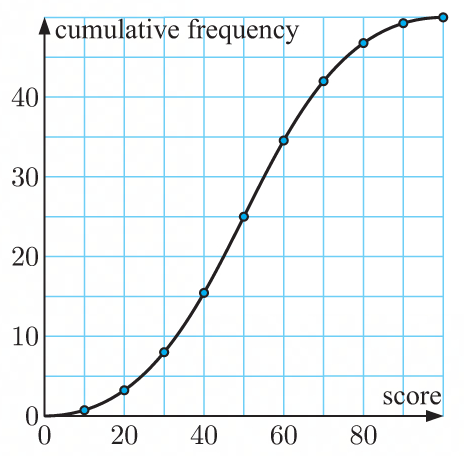
What is 50%?
300
Quickchick grow chickens to sell to a supermarket chain. However, the buyers believe that the supplied chickens are lighter than the minimum advertised weight of 1.2 kg.
These are the hypotheses that will be used to investigate this concern.
What are
Null: u=1.2 kg
Alternative u<1.2 kg
400
Of the games recorded in the table, it's the closest estimate of the mean winning margin.
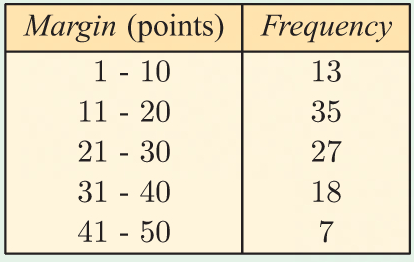
What is 22.6?
400
The value of Spearman's rank correlation r for the following data.
What is -1?
400
A bag contains 3 red, 4 yellow, and 5 blue marbles. Two marbles are randomly selected from the bag with replacement.
As a decimal, the odds that at least one is red.
What is .4375?
400
It's the Spearman's rank correlation coefficient of the data graphed below.
What is -1?
400
A particular chi^2 test has a critical value of 12.592 and a calculated chi^2 value of 5.71. This is the result of the test.
What is: there is insufficient evidence to reject the null hypothesis.
500
In order, these numbers represent the five-number summary of the following data set:
19, 7, 22, 15, 14, 10, 8, 28, 14, 18, 31, 13, 18, 19, 11, 3, 15, 16, 19, 14
What are 3, 12, 15, 19, and 31?
500
As the price of a drink is changed, the sales of the drink also change.
More accurately, the sales change by this much each time the price of the drink goes up by $1.
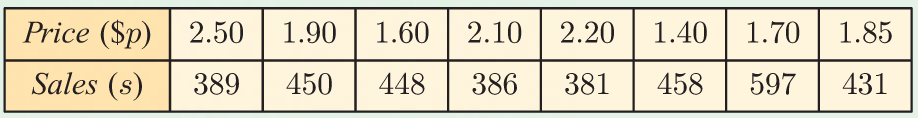
What is, decrease by 116.
500
A soccer goalie saves 18% of penalty kicks shot against her.
In a tied game, each team takes 5 penalty kicks. The goalie figures if she can save at least 2 of the kicks, her team will win.
This percentage represents the probability of her team winning the game.
22.2%
500
A Venn diagram is used to organize the number of students who play soccer (S), rugby (R), or archery (A). This number represents the probability of randomly selecting a student who plays rugby, given they play archery.
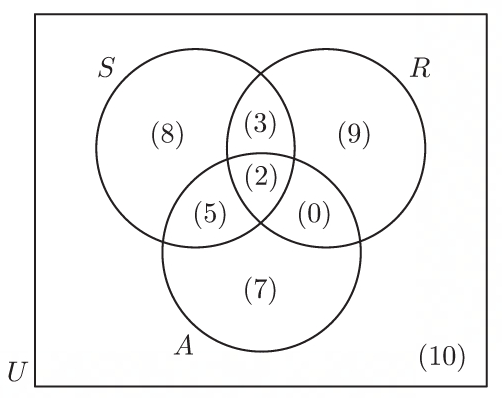
What is
1/7
500
The probability of obtaining the following observed values under the null hypothesis.
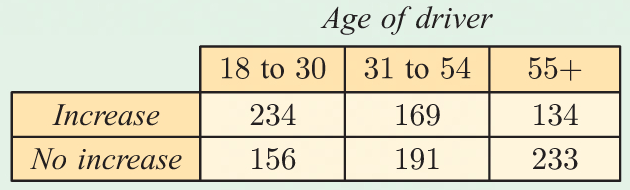
What is 0.000000000737?