Vocabulary
Interpreting Charts
Measures of Center
Measures of Variability
Distribution Types
100
The ____, also called the average, is found by adding up the values in your data set and dividing by the number of data points.
What is the mean?
100
How many data points are in this set?
15
100
What is the mean of that data set:
3, 3, 3, 3, 3
3
100
What is the standard deviation of the data set:
2, 2, 2, 2, 2
0
100
The shape of this distribution is _____
Uniform
200
The middle number in a data set.
What is the median?
200
What size are the intervals on this histogram?
10
200
What is the median of the data set:
4, 2, 6, 1, 0
2
200
Which set has a larger standard deviation:
A: 1, 2, 3, 4, 5
B: 2, 4, 6, 8, 10
B
200
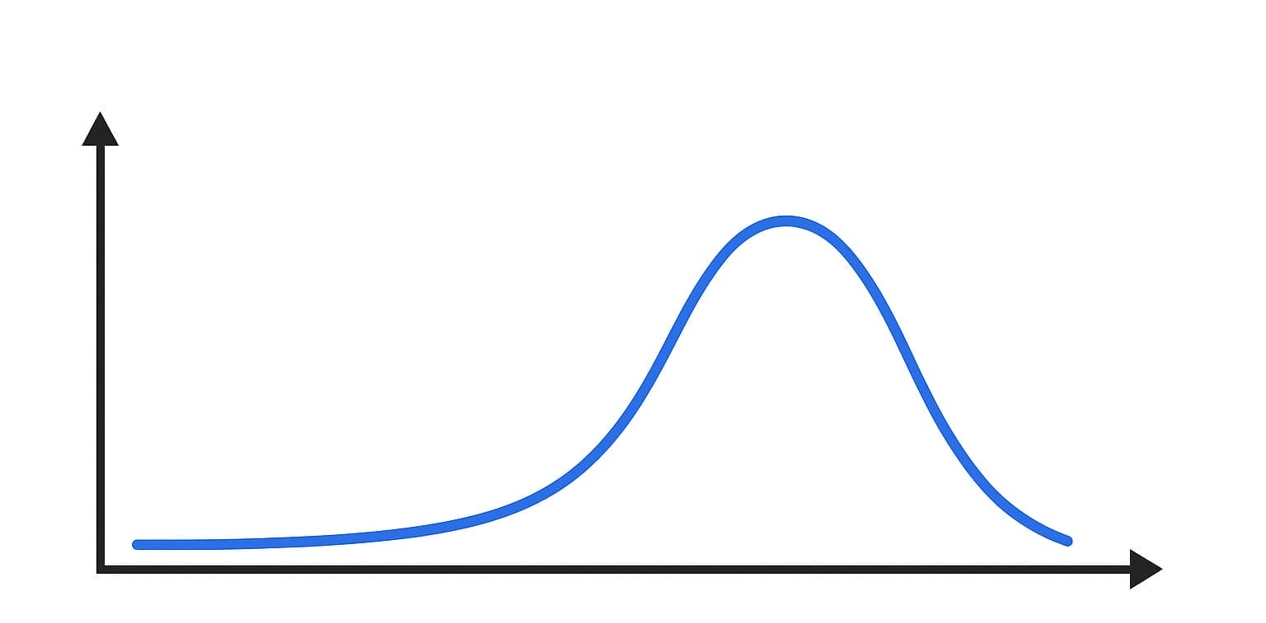
What is this distribution shape called?
Skewed
300
This data answers questions of the form, what type...
What is categorical data?
300
What is the median of the data set represented by this box plot (approximately)?
120
300
What is the median of the set:
3, 1, 0, 4, 7, 2
2.5
300
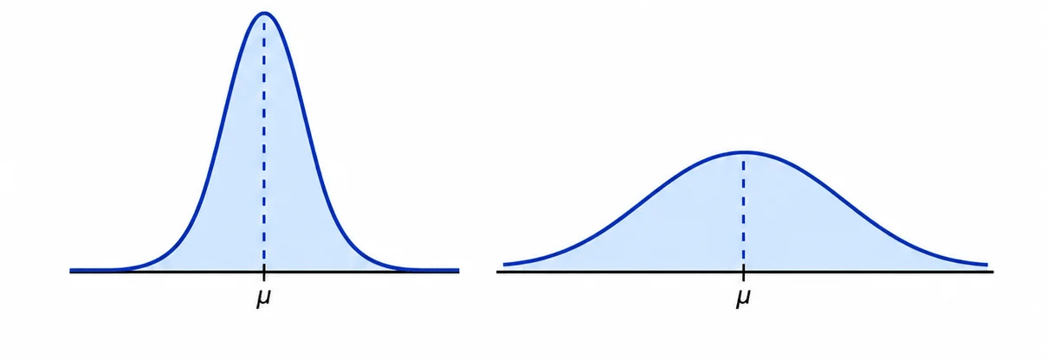
Which distribution (left or right) has a smaller standard deviation?
Left
300
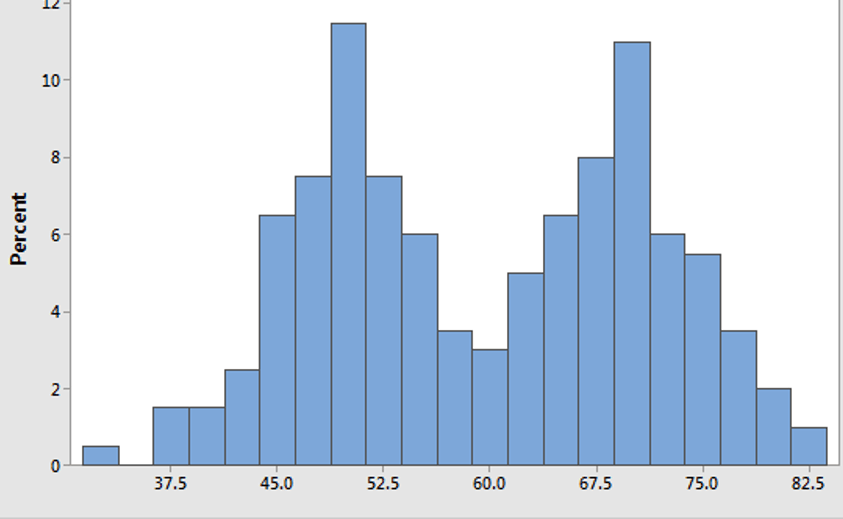
What is this distribution shape called?
Bimodal
400
Taken together, what we call the minimum, maximum, Q1, Q3, and median of a data set.
What is the five-number summary?
400
The mode for this data set is between ___ and ___
60 and 80
400
For the data set:
1, -2, 4, 5, 7, 0, -8, 279, 2, -1, 0
Which is a better measure of center, mean or median?
Median
400
Which plot (left or right) has a bigger standard deviation?
Left
400
What can you say about the mean, median and mode of a bell-shaped distribution?
They are all the same or are all close to each other.
500
This measurement depends on how spread out or compact a data set is about its mean.
What is standard deviation?
500
The IQR for this data set is about ____
1,200 (+/- 200)
500
A: 10, 20, 30, 40, 50
B: 30, 30, 30, 30, 30
Is the mean of data set A less than, equal to, or greater than the mean of data set B?
Equal
500
A data set has a mean of 60 and a standard deviation of 5. 68% of of the data fall between ___ and ___
55 and 65
500
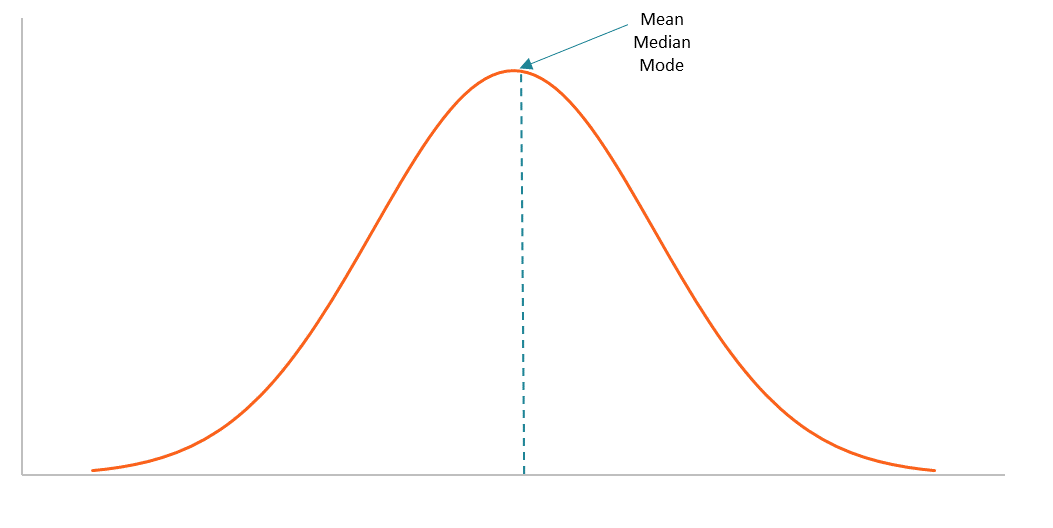 Describe this distribution shape in two ways.
Symmetrical, Bell-shaped