Properties of Numbers
Functions
Relations
Interpreting Graphs etc.
Order of Operations/Like Terms
Dimensional Analysis
Percents
100
Name the property demonstrated:
3x + 0 = 3x
Additive Identity
100
Determine if the graph below is a function. Explain why or why not. 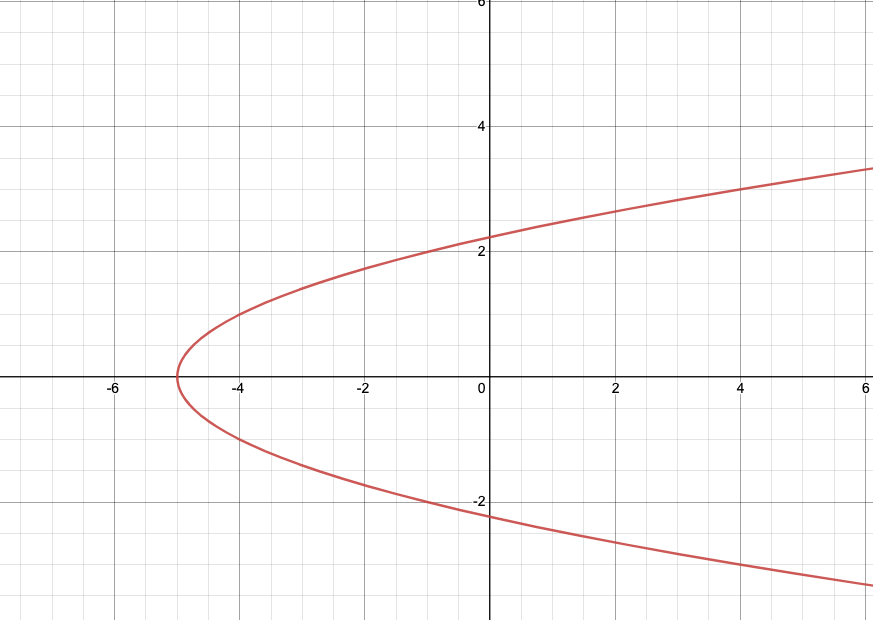
This is NOT a function because it doesn't pass the vertical line test
100
Represent the relation as a graph, a table and a mapping. Determine if it is a function. State the domain and range.
{(1, 1), (2, 1), (3, 1), (4, 1)}
It is a function.
D:{1, 2, 3, 4}
R:{1}
100
Identify the independent and dependent variables:
The air pressure increases when you get to higher and higher altitudes.
independent: altitude
dependent:air pressure
100
3(x + 6) + 2x
5x + 18
100
Convert 2 miles to yards.
3520 yards
100
Find the percent of change and state whether it is an increase or decrease:
original: 30
new: 20
33.33% decrease
200
Name the property demonstrated:
6 * 1/6 = 1
Multiplicative Inverse
200
Find f(5) if
f(x) = x^2 + 6
f(5) = 31
200
Represent the relation as a graph, a table and a mapping. Determine if it is a function. State the domain and range.
{(1, 1), (1, 2), (1, 3), (1, 4)}
It is not a function because the input 1 has four different outputs.
D: {1}
R:{1, 2, 3, 4}
200
Identify the independent and dependent variables:
As you get closer and closer to the sun, the temperature increases.
independent: distance from the sun
dependent: temperature
200
2(x +5) - 3(x-2x2) + 4x2
10x2 -x + 10
200
Convert 10ft/s to yds/hour.
12,000 yds/hour
200
Find the percent of change and state whether it is an increase or decrease:
original: 20
new: 27
35% increase
300
Name the property demonstrated:
3 + 4 = 4 + 3
Commutative Property of Addition
300
Find g(-2) if
g(x) = -3(x-4)
g(-2) = 18
300
Represent the relation as a graph, a table and a mapping. Determine if it is a function. State the domain and range.
{(1,2), (2,3), (3,4), (4, 4)}
It is a function
D:{1,2,3,4}
R:{2,3,4}
300
Describe what is happening in the graph of a car's distance from home below:
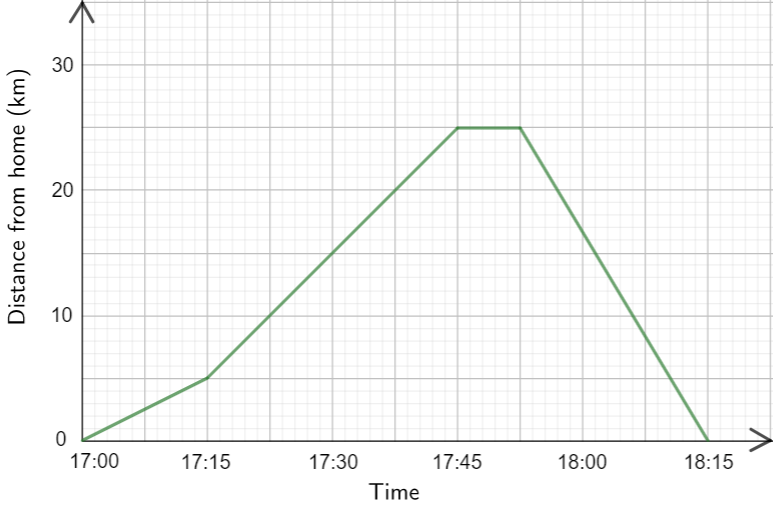
The car leaves home at 5 right at rush hour so they move pretty slowly but pick up speed. Then they arrive and stop for 7.5 minutes to pick up some takeout. Then they get back in the car and have a fast ride home now that traffic has died down.
300
6 * 5 + 6 * (9-1)
78
300
Convert 2 km to inches
78,740.2 in
300
Find the total cost if an item costs $21 and has a tax of 6%.
$22.26
400
Name the property demonstrated:
3 * (4 *2) = (3 *4) * 2
Associative Property of Multiplication
400
Find h(2a) if
h(x) = 7x +4
h(2a) = 14a + 4
400
Represent the relation as a graph, a table and a mapping. Determine if it is a function. State the domain and range.
{(1,2), (2,3), (3,4), (3, 5)}
It is not a function because 3 has two outputs.
D:{1, 2, 3}
R: {2,3,4, 5}
400
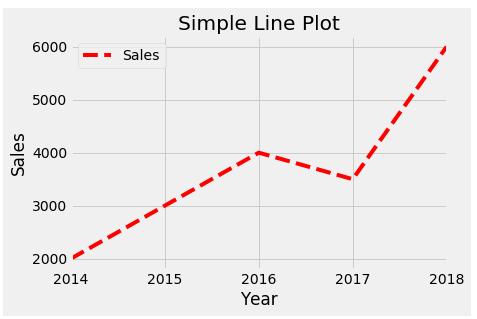 Describe and interpret the graph using the intercepts, relative minima, relative maxima, where it is positive, where it is increasing, where it is decreasing, and the end behavior.
The y-intercept is at $2000 which shows that was how much money in sales they started with in 2014. There are no x-intercepts which mean they never have $0 in sales. There was a relative maximum at (2016, 4000) which shows a peak in sales and a relative minimum at (2017, 3600) which shows a low point in sales. The function is positive everywhere because you can't have negative sales. It is increasing from 2014-2016 and 2017-2018 which shows sales are increasing and it is decreasing from 2016-2017 which shows sales are decreasing. The end behavior shows that sales will keep going up and up.
400
18 \div 6 (3+2) - 4 + 4*3
23
400
Convert 10 km/h to ft/s
9.11 ft/s
400
Find the total price if an item costs $68.50 and is on sale for 15% off.
$58.23
500
Name the property demonstrated:
(x-5)*3 = 3x -15
Distributive Property
500
Find j(b+1) if
j(x) = -3x -5
j(b+1) = -3b -8
500
Represent the relation as a graph, a table and a mapping. Determine if it is a function. State the domain and range.
x =y^2
It is not a function because the input 4 has two different outputs, -2 and 2.
D:{ all numbers greater than 0}
R: {all real numbers}
500
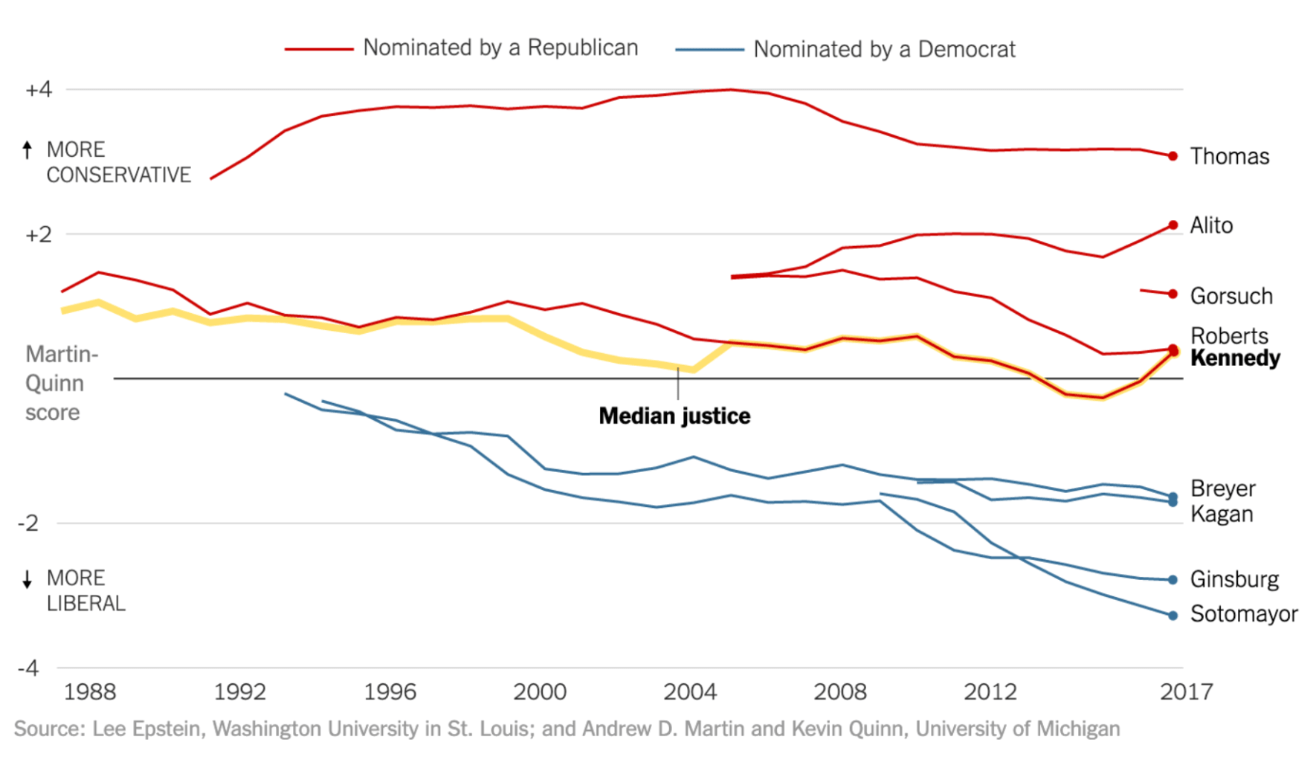 Describe and interpret the graph of the median justice (the yellow one) using the intercepts, relative minima, relative maxima, where it is positive, where it is negative, where it is increasing, where it is decreasing, and the end behavior.
The y-intercept is at 1, which means that is the starting Martin Quinn Score. The x-intercepts are at 2013 and 2016 which means that's when the Martin Quinn Score was zero. The relative minima are at (2004, 0.1) and (2015, -0.3) which are low points for the Martin Quinn Score, showing times when the Median justice is more liberal. The relative maximum is at (2010, 0.8) which is a high point for the Martin Quinn Score, showing a time when the Median justice is more conservative. The graph is positive from 1988-2013 and 2016 onwards which means the Median justice is towards the conservative side in those times. The graph is negative from 2013-2016 which means the Median justice is towards the liberal side in those times. The graph is decreasing from 1988-2004 and 2010-2015 which shows the Median justice is getting more liberal. The graph is increasing from 2004-2010 and 2015 onwards which shows the Median justice is getting more conservative in those times. The end behavior shows the Median justice will continue to trend towards more conservative.
500
6 \div 2 (3+4) + 12(6+7) - (6-4)\div3
176 \frac{1}{3}