HSF.IF.B.6 - Determine Rate of Change
HSF.IF.B.4 - interpreting functions in application as they arise in terms of the context
HSA.REI.C.6 - create a system of linear equations
HSA.REI.D.12 - write system from a graph
HSA.SSE.B.3.C - properties of exponential functions
100
Carrie wants to find out how the area of a circle will change as the radius increases in length. Carrie makes a table.

What is the average rate of change in the area as the radius changes from 2.5 to 5.5 feet?
25.12 sq ft per foot
100
Which of the following graph represents a line that has an x-intercept of -2?


Answer: A
100
What is the solution to this system of equations?

x = -1
y = -3
100
What inequality does this graph represent?

100
Simplify.
x6y14
200
The graph shows the relationship between the weight, in pounds, of Vidalia onions and their cost.
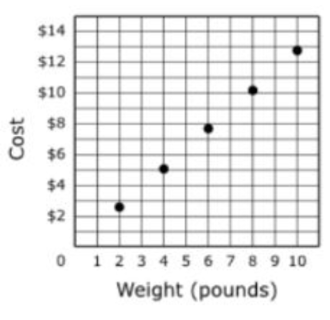
Which best estimates the cost per pound?
1) $0.78
2) $1.29
3) $2.58
4) $10.32
Answer: 2
200
A certain amount of concentrate is mixed with water to create juice. The table shows the amount of concentrate, in ounces remaining, in the original container after x ounces of juice are made.

How many ounces of concentrate were in the original container before any juice was made?
320 ounces
200
Two families buy refreshments at a concession stand.
- Each drink costs d dollars
- Each snack costs s dollars
- The Blake family buys 3 drinks and 2 snacks for $12
- The Reese family buys 2 drinks and 4 snacks for $16
What is the costs of ONE DRINK at the concession stand?
1) $2
2) $3
3) $4
4) $5
Answer: $2
200
What inequality does this graph represent?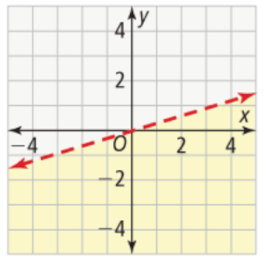
y < 1/3x
200
Simplify the expression.


300
A 12-foot-long wooden beam is supported on both ends. When a weight load is placed in the center of the bean, it causes the mean to sag. The sag is called deflection. The graph shows the deflection of the bean, in inches, as a function of the weight load, in pounds, placed in the center of the beam

For every 50-pound increase in the weight load, what will be the change in the deflection?
1) an increase of 0.50 inch
2) a decrease of 0.50 inch
3) an increase of 0.25 inch
4) a decrease of 0.25 inch
Answer: 3
300
A cyclist competing in a race rides past a water station. The graph of the function d(t)=1/3|t-60| shows her stance from the water station at t minutes. Assume the graph represents the entire race. What does the graph tell you about her race?

Answers may vary: The race started 20 km from the water station. The cyclist rode at a constant rate of 1/3 km/min, reaching the water station in 60 min. The water station was at the halfway point of the race.
300
Nancy, Bryan, and Jamie combined their money to purchase a laptop. Together they paid a total of $490 for the laptop, including tax.
- Nancy paid $50 more than Bryan paid
- Bryan paid twice as much as Jamie paid
How much did Nancy pay?
1) $108
2) $176
3) $226
4) $295
Answer: $226
300
Which graph BEST represents the solution to this system of inequalities?
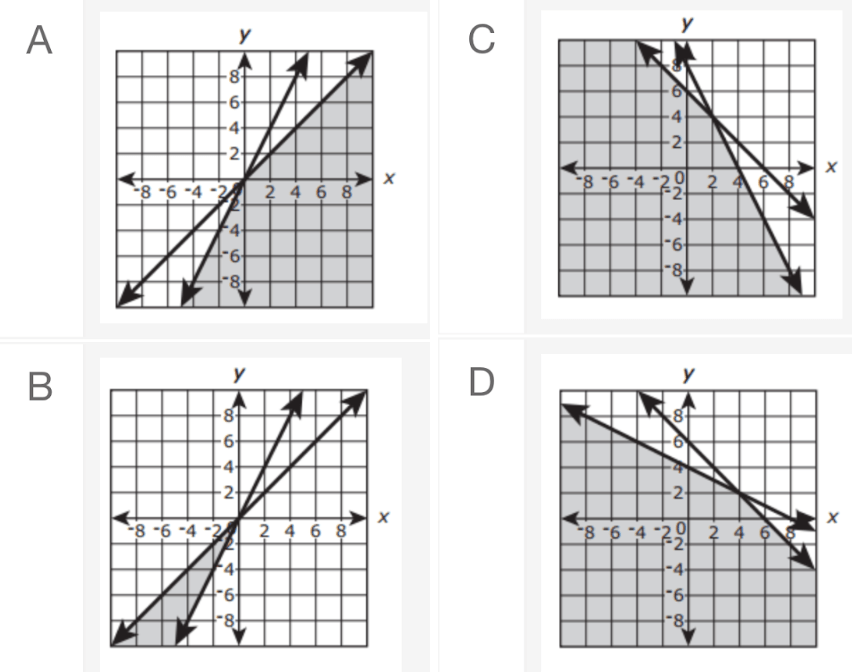
Answer: D
300
Simplify.

