What is the mean of the set {21, 22, 23, 24, 25, 26, 27}
24
What is the range of the data set {51, 52, 68, 70, 88}
27
In a standard normal distribution, what percentage of data falls within 1 standard deviation of the mean?
68%
What are the names of the 5 numbers that make up the 5-number summary.
Min, Q1, Med, Q3, Max
What is the total number of pets owned?
34
What is the area of a triangle with a base of 12 and height of 12?
72.
What is the median of the set {33, 31, 29, 22, 18, 30, 17, 30, 21}
29
What is the standard deviation of the set {22, 25, 27, 30, 36}?
4.8
In a normal distribution, what percentage of the data falls within 2 standard deviations of the mean?
95%
What is Q1 in the box plot below?

33
What is the modal group of the data shown?
Cats
What is the result of multiplying the reciprocal of \frac{1}{4} by the reciprocal of \frac{1}{8} ?
32
Use the box plot to find the median books read.
5
What is the range of the data?

8
The average number skittles in a bag is 54 with a standard deviation of 1.5. If the distribution of skittles is approximately normal, what percentage of bags have between 54 and 57 skittles?
47.5%.
Which box plot has the lowest priced item?

Store 1
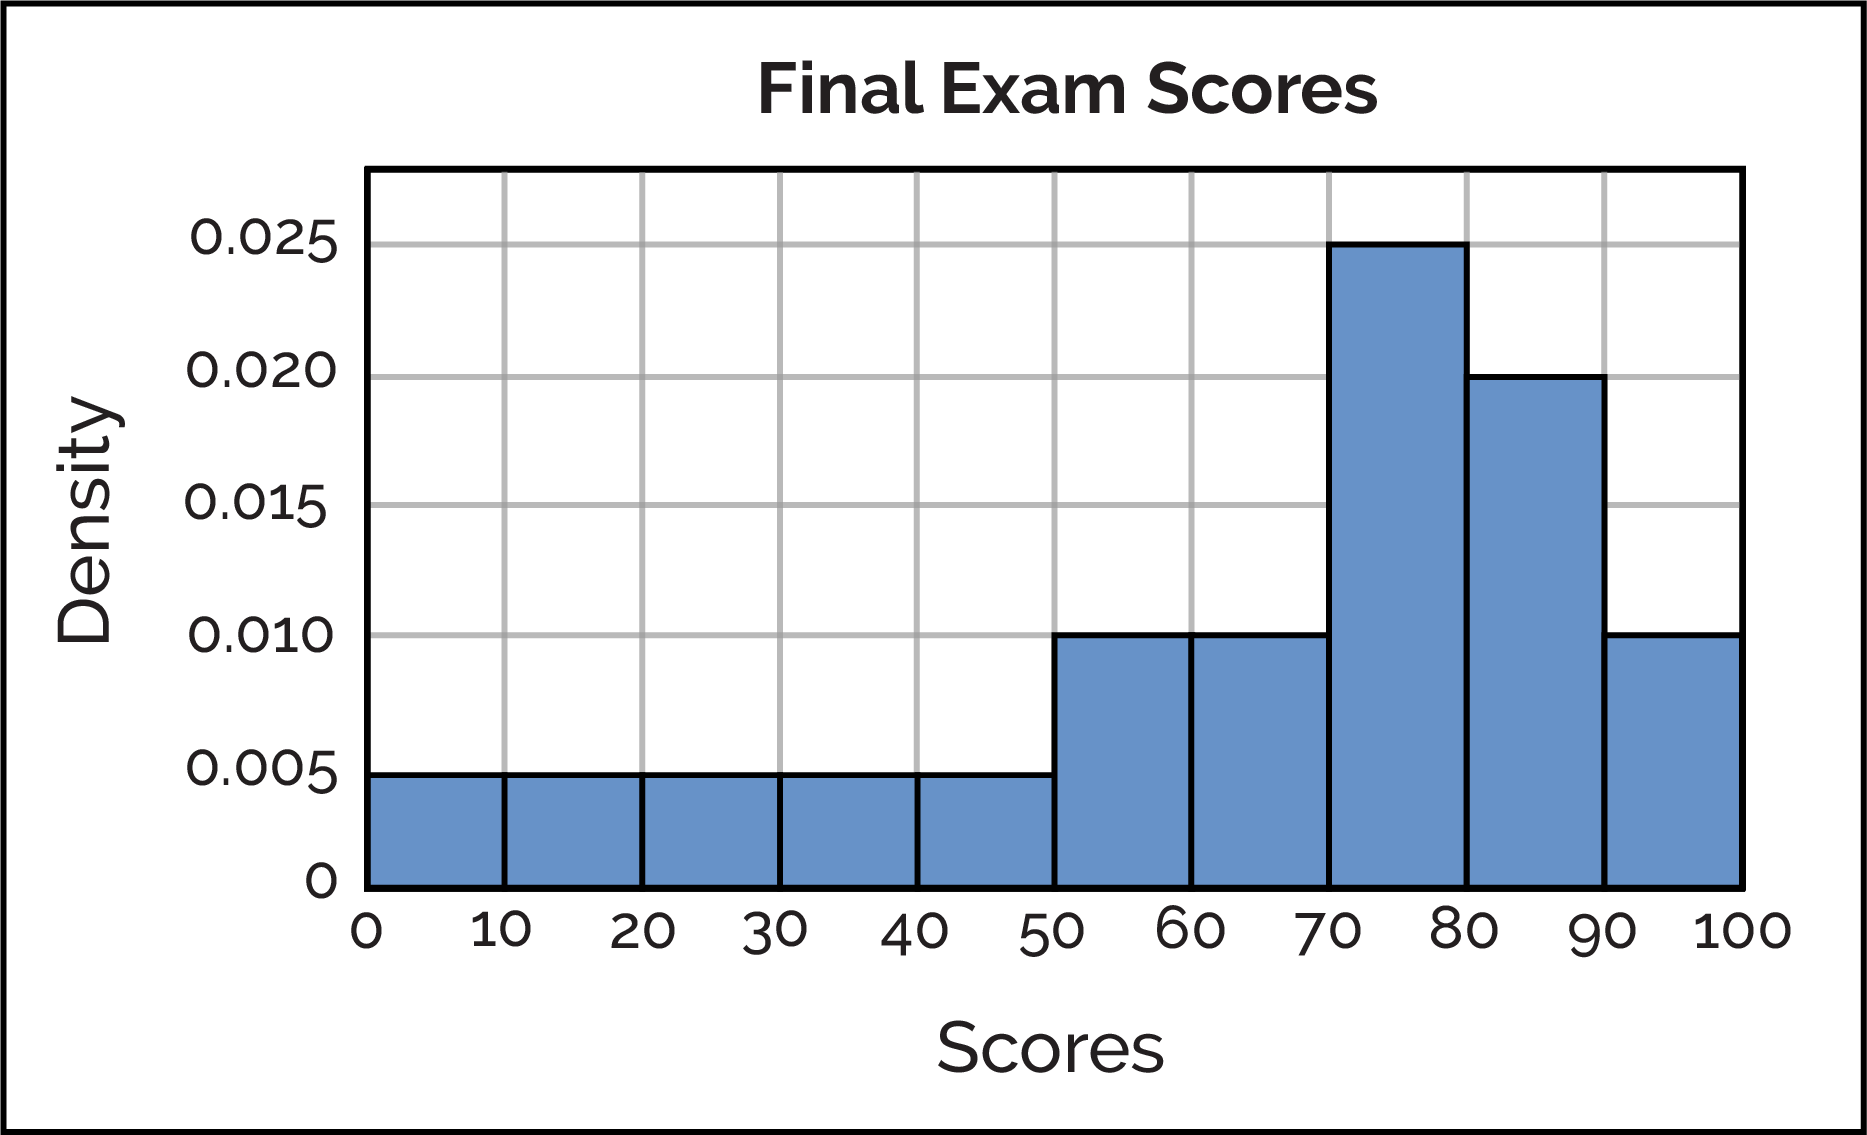
In which range of values does the  median fall?
50-60.
What is the radius of a circle who has a diameter of 12\pi ?
6
List in order from least to greatest, the mean, median and mode.

Mode, media, mean.
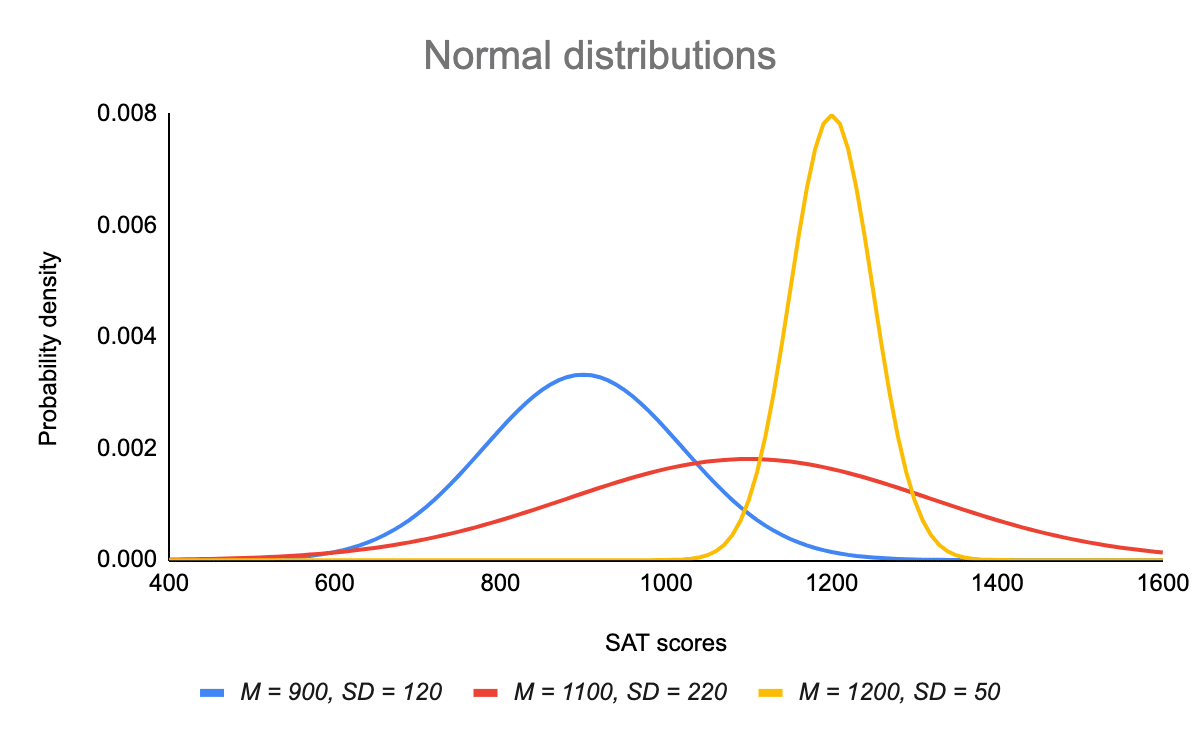
List the graphs from lowest standard deviation to highest standard deviation.

Yellow, blue, red
The average number skittles in a bag is 54 with a standard deviation of 1.5. If the distribution of skittles is approximately normal, what percentage of bags have less than 51 skittles?
2.5%
Identify the skewness of the box plot.

Skewed Right.
In which range of values does Q1 fall?

30-40
In the diagram, QRS is a straight line. What is the measure of \angle RPS in degrees?

27
The mean score on 10 tests taken this spring was a 90. If I removed a score of 60, what is the is the new mean? Round your answer to the nearest tenth.
93.3
Which method of teaching led to the highest IQR?

Method 3
The average number skittles in a bag is 54 with a standard deviation of 1.5. If the distribution of skittles is approximately normal, what percentage of bags have more than 52.5 skittles?
84%
Which box plot below has the highest standard deviation? 
USA
Describe the shape of distribution.

Skewed left.
Evaluate \log_6 2+log_6 18
2