Frequency Tables
Measures of Center & Spread
Data Display & Distributions
Linear Regression
Christmas Trivia
100
Explain the difference between qualitative and quantitative data.
qualitative data deals with categories, quantitative data deals with numbers
100
Describe how to find the mean, median, mode, and range.
mean: average
median: middle number
mode: most often
range: max-min
100
What is this type of graphical representation?
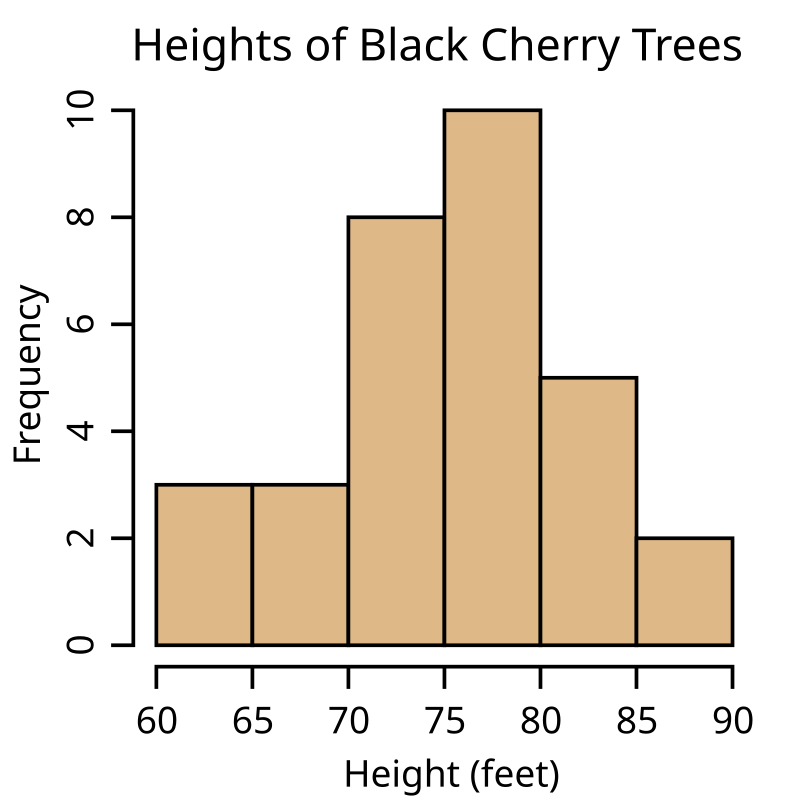
Histogram
100
In a scatter plot, what does strong correlation mean? Weak correlation?
strong correlation means that points are close together, weak correlation means that points are spread further apart
100
What does your true love give you on the 3rd Day of Christmas?
3 French Hens
200
How many total people were surveyed in this two-way frequency table?
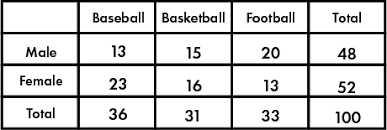
100
200
Calculate the mean of the data set:
151, 153, 146
150
200
Describe the shape of this distribution:

Skewed to the left
200
Sketch a scatterplot that shows "no correlation"
(on graph)
200
In "A Christmas Carol", what is Scrooge's first name?
Ebeneezer
300
What percentage of the males surveyed prefer basketball?

31.25%
300
Construct a box plot of the data set:
1, 2, 2, 3, 3, 4, 4, 5, 6, 6, 7, 7, 8, 8, 9
Min: 1
Q1: 3
Med: 5
Q3: 7
Max: 9
300
In a set of normally distributed data, about what percent of the data is within 1 standard deviation of the mean?

68%
300
Describe the correlation of the scatterplot:

weak positive
300
In the song "Frosty the Snowman", what is Frosty's nose made out of?
a button
400
What percentage of people surveyed preferred baseball?

36%
400
Calculate the standard deviation of the data set. You may use a calculator.
80, 74, 77, 71, 75, 91
6.4
400
What is the mode of the data set:

10
400
Use the formula for the line of best fit (below) to predict the height of a maple tree that is 13 inches wide (interpolation).
y=1.969x+1.557
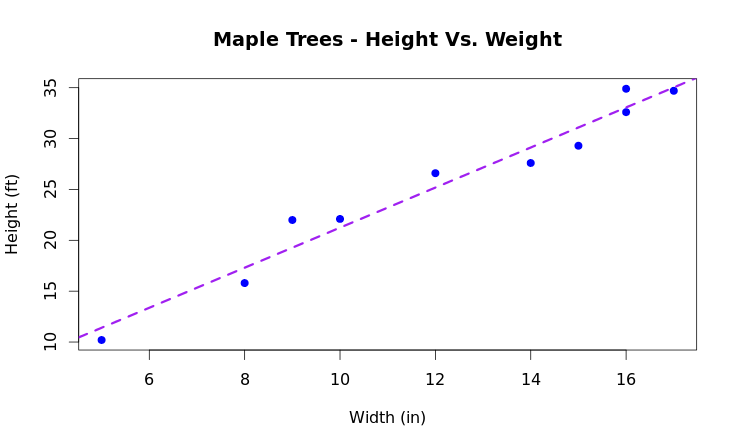
about 27 feet high
400
Who is this? For 200 extra points, what does he want for Christmas?

Ralphie; Red Ryder BB Gun
500
What percentage of people who preferred football were female?

39.39%
500
Are there any outliers in the following data set:
25, 30, 35, 35, 35, 40, 40, 40, 45, 45, 50, 60, 90
SHOW YOUR WORK
90>66.25
500
Construct a dot plot of the following data:
18, 22, 26, 31, 25, 20, 23, 26, 29, 30
(on paper)
500
Use the formula for the line of best fit (below) to predict the height of a maple tree that is 20 inches wide (extrapolation).
y=1.969x+1.557
40.937 ft high
500
How many ghosts show up in A Christmas Carol?
4