Correlation
LSRL
Displaying Two Variable Data
Explanations
Miscellaneous
100
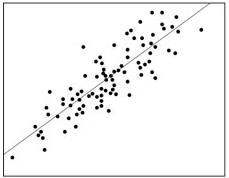 What is the value of this correlation coefficient (r) in the relationship represented by graph?
What is 0.85?
100
At least squares regression line
What does LSRL stand for?
100
A graph in which the values of two variables are plotted along two axes, the pattern of the resulting points revealing any correlation present.
What is scatterplot?
100
Example is:
For every hour I worked, there is an average increase on my paycheck by $13.00 .
What is slope?
100
In DUFS the possible answers for letter F (Form) are ______and_______?
What is linear of not linear?
200
It has no units
What is the correlation coefficient - r?
200
It should be randomly scattered indicating that a linear model is appropriate.
What is Residual plot?
200
In some research studies one variable is used to predict or explain differences in another variable. In those cases, the explanatory variable is used to predict or explain differences of the ____________
What is response variable?
200
Set up: y = height of a plant in cm , x = age in months, where yˆ = 1.2 + 2.3x
Example: When the plant is 0 months old, I would predict that the height would be 1.2 cm.
What is the y -intercept?
200
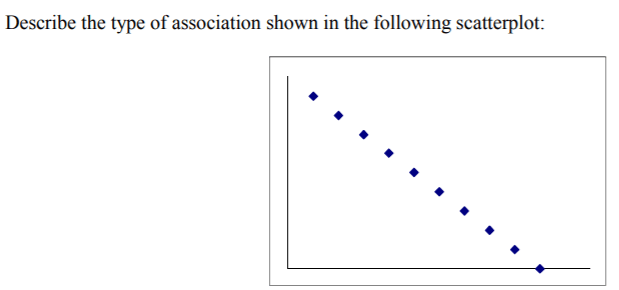
What is negative linear association?
300
In DUFS it can be weak, strong, moderate.
What is the strength of the regression?
S in DUFS!
300
_________ % of the variability in (context of y) can be explained by the linear association with (context of x)
What is Coefficient of determination (r squared)
300
Residuals are
(A) possible models not explored by the researcher.
(B) variation in the response variable that is explained by the model.
(C) the difference between the observed response and the values predicted by the model.
(D) data collected from individuals that is not consistent with the rest of the group.
(E) a measure of the strength of the linear relationship between x and y
What is (C) the difference between the observed response and the values predicted by the model.
300
Set up: y = height of a plant in cm, x = age in months, where yˆ = 1.2 + 2.3x
Example:.For every additional month, there is an average increase in the plant’s height of 2.3 cm.
What is slope?
300
In the simple linear regression equation, the symbol yˆ (y-hat) represents the
A. average or predicted response
B. estimated intercept
C. estimated slope
D. explanatory variable
What is A. average or predicted response ?
400
A perfect uphill (positive) linear relationship
What is 1?
400
Which one of these statements is for sure false?
(A) The correlation between a football player’s weight and the position he plays is 0.54.
(B) The correlation between a car’s length and its fuel efficiency is 0.71 miles per gallon.
(C) There is a high correlation (1.09) between height of a corn stalk and its age in weeks.
(D) The correlation between the amounts of fertilizer used and quantity of beans harvested is 0.42.
(E) There is a correlation of 0.63 between gender and political party.
What is (C) There is a high correlation (1.09) between height of a corn stalk and its age in weeks?
400
Child development researchers studying growth patterns of children collect data on the heights of fathers and sons. The correlation between the fathers’ heights and the heights of their 16-year-old sons is most likely to be…
(A) near −1.2 (C) near +0.7
(B) near 1.3 (E) somewhat greater than +1.0
What is near +0.7?
400
Example: 89.3% of the variability in the height of the plant can be explained by the linear association with the age of the plant.
What is coefficient of determination (r squared) ?
400
A group of middle school students wants to know if they can use height to predict age. They take a random sample of 50 people at their school, both students and teachers, and record each individual's height and age. The students want to use height to predict age so the explanatory variable is _______?
What is height?
500
An example of a weak downhill (negative) linear relationship
What is r= between -0.1 and -0.5?
500
Data was collected on two variables x and y and a least squares regression line was fitted to the data.
The resulting equation is y=−2.29 +1.70x .
What is the residual for when x=5 and y=6?
What is −0.21
500
The ______ indicates that there is a (strong, moderate, weak), (positive, negative) linear relationship between (context of y ) and (context of x ).
What is Correlation coefficient (r )?
500
The relation between the selling price of a car and its age (in years) is estimated from a random sample of cars of a specific model. The relation is given by the following formula: SellingPrice = 22,000 − (2,356)Age Which of the following can be concluded from this equation?
(A) For every year the car gets older, the selling price drops by approximately $2356.00.
(B) For every year the car gets older, the selling price goes down by approximately 23.56 percent.
(C) On average, a new car costs about $22,000.
(D) On average, a new car costs about $2,356.00.
What is (A) ?
For every year the car gets older, the selling price drops by approximately $2356.00.
500
If the coefficient of determination r2 is 0.49, then the correlation coefficient r is?
What is 0.70 ?