Organizing Data
Data Relationships
Producing Data & Experiments
Probability
Inference & Tests
Distributions
100
acronym we use to describe data distributions and what each letter tells us to do
SOCS
Shape
Outliers
Center
Spread
100
define response and explanatory variables
an explanatory variable explains or predicts changes in the response variable, and the response variable measures the outcome of a study
100
Main difference between observational studies and experiments
treatment
100
What does this formula help you find?
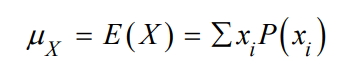
The mean (expected value) of a discrete random variable
100
when do you use z-test and when do you use t-tests?
z-test for proportions t-test for means
100
command to find the z-scores given area
inverseNOrm
200
what does a percentile tell us?
the value with p percent of observations less than te value itself
200
how do you classify weak, moderate, or strong correlation?
weak is less than .3, moderate is between .3 and .7, strong is more than .7 in either the positive or negative direction.
200
what are stratified and cluster sampling?
stratified: levels
cluster: groups
200
when working with random variables, doing this changes measures of but does not change measures of spread
What is adding a contant?
200
what do we say when we interpret confidence intervals?
we are 95% confident that the true population proportion mean of whatever lies within lower bound and upper bound
200
command to find the critical value for a t-distribution
inverset
300
what does the standard deviation measure?
the typical distance of the values in a distribution from the mean
300
acronym we use to describe linear relationships, and what each letter stands for
DOFS
Direction
outliers
form
strength
300
difference between random sampling and simple random sampling?
random sampling means every individual has an equal chance. Simple random sampling means every group and individual have an equal chance of being chosen as part of that group.
300
when working with random variables, doing this changes both measures of center and spread.
what is multiplying by a contant?
300
what do we say when we interpret confidence levels?
Over many repeated samples, 95% of the samples would contain the true population mean/proportion.
300
if you have to find a 90% confidence interval for a population mean, what area do you type for the inverse t function?
divide the area in the tails by 2 and add it to the confidence level
400
What is the 5 number summary and how do you find each value?
Min
Q1
Median
Q3
Max
400
How do you know if an observation is an outlier or an influential observation?
an influential point is one that if removed will affect the calculation. Usually these are outliers in the x-direction.
400
phrases to remember stratified and cluster sampling
stratified is same within different between
cluster is different within same between
400
What are the formulas to check if events A and B are independent?
P(A|B)=P(A) and P(B|A)=P(B)
400
when do you reject the null hypothesis?
when your p-value is lower than the alpha value
400
how do you find degrees of freedom for t-distribution?
n-1
500
Describe how you can tell if a distribution if left skewed, right skewed, or symmetric using these two measures?
mean equals median it is symmetric
mean is higher than median then it is right skewed
mean is lower than median then it is left skewed
the mean follows the tail
500
how do we interpret slope in context?
when the explanatory variable increases by one unit, the response variable is predicted to increase/decrease by these many units.
500
difference between a blind and double blind experiment
blind experiment only the individuals do not know
double blind neither the individuals nor the researchers know who gets the treatment or placebo.
500
In words describe
what is the mean of the sum of 2 or more random variables,
what is the mean of the difference of 2 or more random variables
what is the variance of the sum of 2 or more random variables
what is the variance of the difference of 2 or more random variables
and what is special about the standard deviation of the variance of the sum or difference of 2 or more random variables?
the mean of the sum is the sum of the means
the mean of the difference is the difference of the means
the variance of the sum is the sum of the variances
the variance of the difference is the sum of the variances
the standard deviation is the square root of the sum in both cases of the sum or difference.
500
what is more dangerous a Type I or a Type II error?
depends on the situation
500
difference between, population, sample, and sampling distribution.
population is all the individuals
sample is one a sub sample of individuals
sampling is a distribution of the mean (or other statistic) of many samples drawn from the population.