Sec 1A - Learning from Data
Sec 1B - Displaying and
Describing Categorical Data
Sec 1B - Displaying and
Describing Categorical Data
A farmer has 1000 dairy cows and wants to estimate the minimum daily milk production for dairy cows in the herd. For 20 randomly chosen dairy cows, the minimum production was 6.3 gallons.
Identify the Population, sample, parameter and statistic
Population: All 1000 cows in the herd
Sample: 20 Random cows from the herd
Parameter: Minimum milk production of all 1000 cows
Statistic: Minimum production of 6.3 gallons
Here are the weights (in grams) of 17 Snickers Fun Size bars from a single bag:

A. Make a stem-and-leaf plot of the data.
B) The advertised weight of the bars is 17 grams. Can you justify this claim from the graph? Explain.
A) 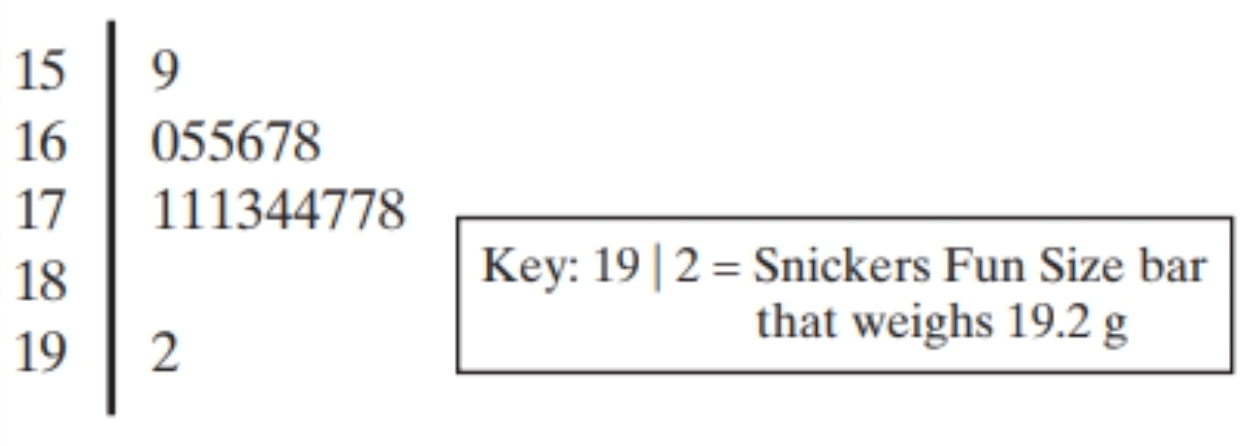
B) Yes. The majority of the candy bars are 17 or more grams in weight (~59%)
Consumer reports magazine rater different types of refrigerators, including those with bottom freezers, top freezers and side freezers. One of the variables it measured was annual energy cost (in $). The following boxplots show the energy cost distributions of these types:
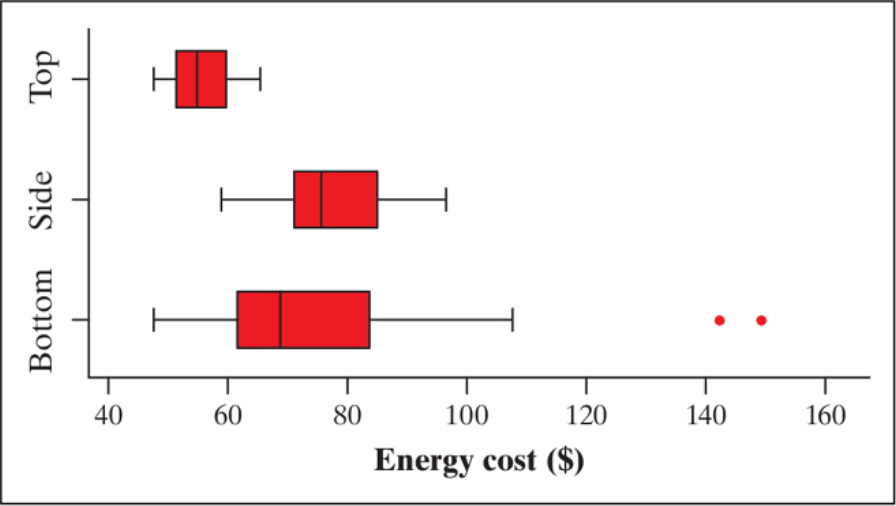
A. From the boxplots, what can you say about the percentage of each freezer that costs more than $60?
B. Compare the energy cost distributions of the three types of refrigerators.
C. Which one should you buy to be economic in the long term?
A. About 25% of top, almost 100% of side and 75% of bottom cost at least $60 a year to operate.
B. Center: Top-~$55, Side-~$75, bot-~$65
Outliers: Top & Side-None, Bottom- ~140 & 150
Shape: Top & Side-R.Symm, Bot-Skew Right
Spread: T - IQR ~$10, Side - IQR ~$15, bottom - IQR ~$20
C. The best for long term money saving are top freezers.
What are 3 different types of sampling. How are they different?
What are the 2(3?) different types of experimental design?
Sampling:
-Stratified: break your population into strata and either randomly select equal groups, or proportional groups, to be used in the sample
-Cluster design - identify homogenous groups and randomly select from the groups.
-SRS - just select randomly from the population
Design:
Block - Separate your sample by specific characteristics
Matched pairs - a special block where we match pairs of experimental units/subjects based on the # of treatments where they either do 1, or both treatments.
Completely randomized - randomly assign your subjects
The pie chart displays the distribution of the designated state tree by type for the 50 US states. The category 'other' includes all trees that are the state tree for two or fewer states. Which is true?
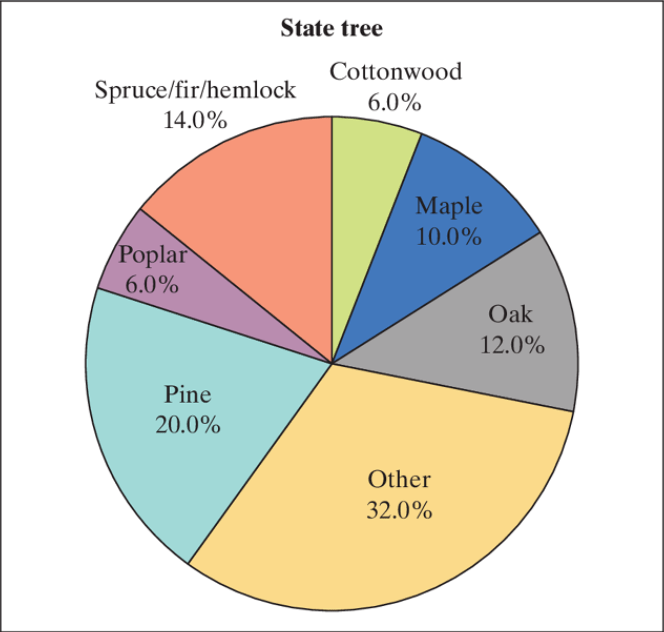
A) The cottonwood is the state tree for 12 states
B) Taken together oak, pine and maple are the state trees for more than half the states
C) There are 10 states that have designated pine as their state tree.
D) There is no state that has designated the eastern red cedar as its state tree.
C. 20% of 50 is 10.
Name a president between the 15th through 20th president
Bonus if you get 3 or more (without just naming as many as possible)
#15. James Buchanan
#16. Abraham Lincoln
#17. Andrew Johnson
#18. Ulysses S. Grants
#19. Rutherford B. Hayes
#20. James A. Garfield
Identify observable units, categorical and quantitative variables (include discrete/continuous)
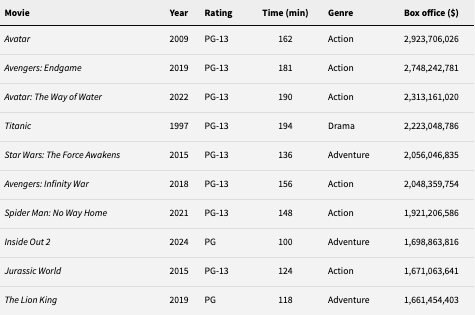
Observable units: Movies
Categorical variables: Year, Rating, Genre
Quantiative variables: time(C), gross(D)
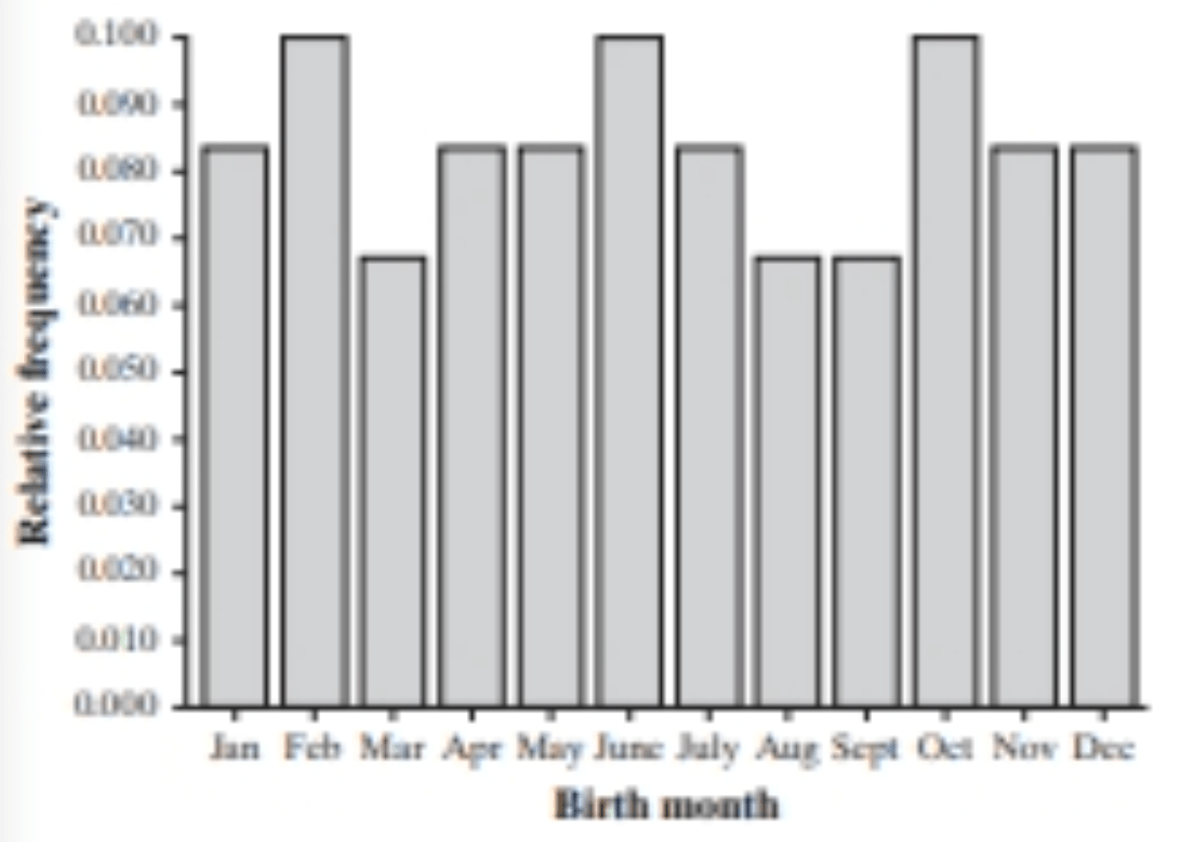
Imagine asking a random sample of 60 students from your school about their birth months. Should you use a bar chart of a histogram to display the data?
Draw a plausible graph of the distribution of birth months.
A bar chart. The variable is categorical.
The shape of the graph should be somewhat uniform.
A national survey asked a random sample of 95,505 first-year college students about specific academic behanviors identified by college faculty as being important for student success. One question asked, "How often in the past year did you ask questions during class?" The figure is a side-by-side bar chart comparing the percentage who answered frequently by race/ethnic group and whether the respondent was a first generational college student.
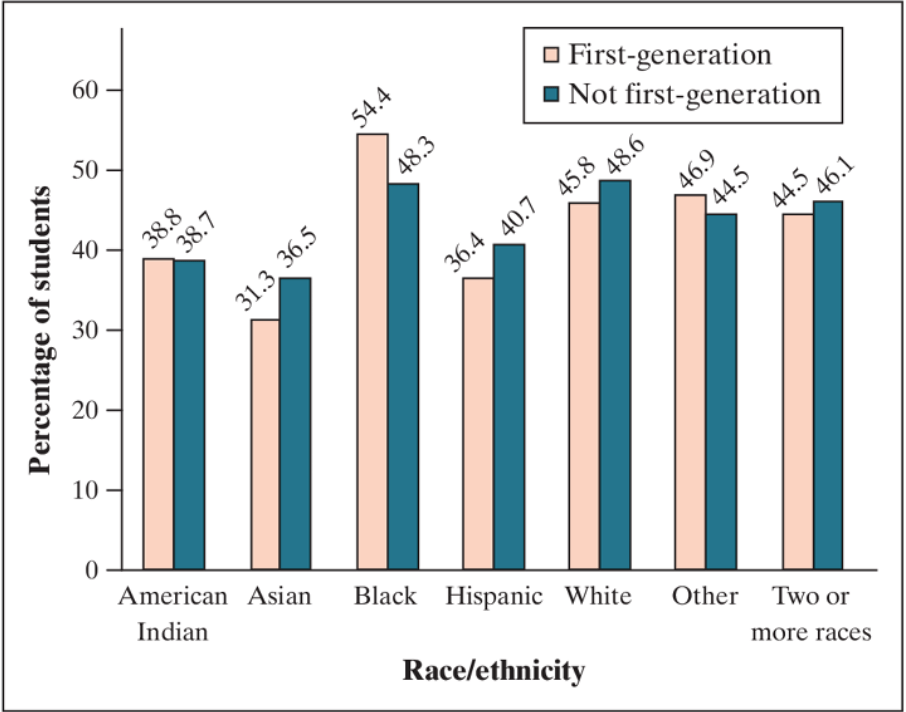
A. Identify population and sample
B. Identify variables and classify each.
C. Can we use the graph to justify the claim there is a consistent difference in proportion of first-generation and not-first-generation college students who would say they frequently asked questions in class.
A. Population: All first-year college students; Sample: the 95,505 first-year college students.
B. Type of students, race/ethnicity and frequently asked questions in class (ALL categorical)
C. No. There is not a big enough difference in proportions to claim that there is a difference.
The owner of a large restaurant is considering a new 'no tipping' policy and wants to survey a sample of employees using a stratified random sample. The policy would add 20% to th price of food and beverages, and the additional revenue would be distributed equally among servers and kitchen staff.
A. What would be a good variable to use when forming strata?
B. What would NOT be a good variable to use when forming strata?
C. Using the variables in part A, describe how to select a stratified random sample of approximately 30 employees. (assume only 2 positions)
A. Position/Job or amount of hours worked
B. Pay, how long they've worked there etc. (pretty much anything else but part A)
C. Put each job title in different strata and randomly select from the 15 for both groups individually.
AJ's score on Exam 1 was at the 64th percentile of the scores in a large statistics class. AJ's score falls in:
A. Between minimum and Q1
B. Between Q1 and M
C. Between M and Q3
D. Between Q3 and maximum
C. The 64th percentile must be between M and Q3 (they hold the percentiles between 50-75)
Of the 8.3 billion people on the planet, how many:
a. have a (mobile) phone?
b. Have access to functioning toilets
a. 6 billion
b. 4.5 billion
Here is a pie chart of U.S. Census Bureau data showing the origin of more than 62 million Hispanic people in the United States.
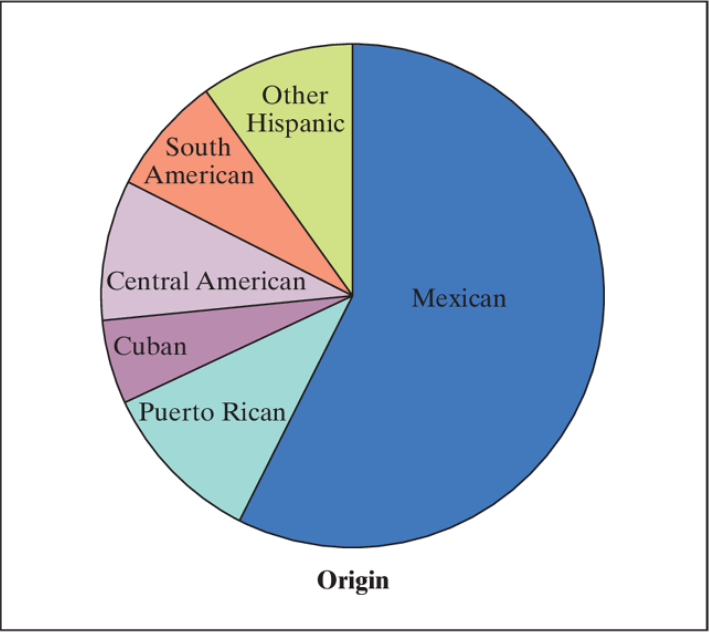
A) About what percentage of Hispanic people in the US are of Mexican origin? Puerta Rican origin?
B) Can we use this graph to justify the claim that South American origin makes up the smallest proportion of Hispanic people in the US?
A) about 60% appear to be of Mexican origin. About 15% appear to be of Puerto Rican origin,
B) No. Cuban seems to be the smallest group of hispanic origin.
In 2021, college student loan debt in the US reached $1.71 trillion. At the time, there were 45.3 million US borrowers with student loan debt. More than 3 million had student loan debts greater than $100,000; about 900,000 had student loan debts greater than $200,000.
A. Find the mean amount of student loan debt per borrower in 2021.
B. Do you think the median amount of student loan debt was greater than or less than the mean amount? Justify your answer.
A. (1,710,000,000,000)/(45,300,000)=$37,748.34
B. The median will be smaller than the mean as the shape of this graph would be skewed right, causing the mean to increase.
The ability to grow in the shade may help pine trees found in the dry forests of Arizona to resist drought. How well do these pines grow in shade? Investigators planted pine seedlings in a greenhouse in either full light, light reduced to 25% of normal by shade cloth, or light reduced to 5% of normal. At the end of the study, they dried young trees and weighed them.
A. Identify the explanatory and response variables
B. Identify the experimental units and treatments
A. Explanatory: Amount of light; Response: Weight of the dried tree
B. Experimental Units: The pine seedlings; Treatments: Full light, 25% light and 5% light
You are on the staff of a member of the US Senate who is considering a bill that would provide government-sponsored insurance fot nursing-home care. You report that the senator's constituents have submitted 1128 comments on the issue, of which 871 oppose the legislation. "I'm surpirsed that most of my constituents oppose the bill. I thought it would be quite popular", says the senator. Are you convinced that a majority of the senators constituents oppose the bill? Explain.
No. This is a voluntary response, where people unhappy are more likely to respond than happy ones.
The senator should do a survey to get a more accurate opinion from his whole constituency rather than just the vocal ones.
A gardener wants to try different combinations of fertilizer (none, 1 cup and 2 cups) and mulch (none, wood chips, pine needles and plastic) to determine which combination produces the highest yield for a variety of green beans. The gardener has 60 green bean plants to use in the experiment. If the gardener wants an equal number of plants to be assigned to each treatment, how amny plants will be assigned to each treatment?
A. 3, B. 4, C. 5, D. 12
C. 5 there are 12 possible combinations. So 60 seeds/12 combinations=5
Draw me in 40 years
No gravestones :(
A survey asked first-year college students, 'How many miles is this college from your permanent home? Compare the distributions of distance from home for students from private and public 4 year colleges who completed the survey.
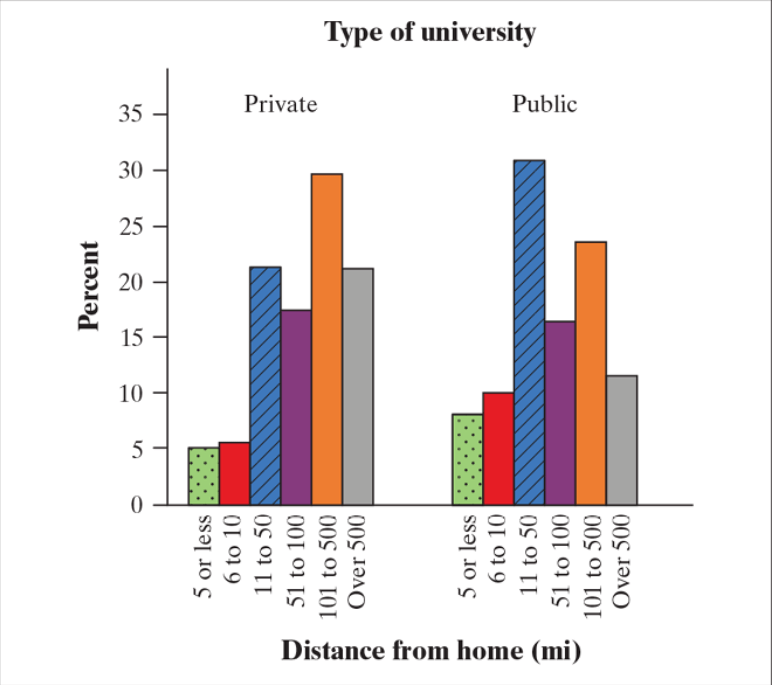
Both groups most commonly chose 11 or more miles from home. The private most commonly were between 101-500 miles from home, while public were between 11 to 50 miles from home.
This is a sstandard deviation contest. You must choose 4 whole numbers 0 to 10, with repeats allowed.
A. Choose four numbers that have the smallest standarad deviation
B. Choose 4 numbers that have the largest standard deviation
C. Is more than 1 choice possible for part A and B?
A. All 4 of the numbers are the same
B. 0,0,10,10
C. For A there are many answers, but for B there is only one answer.
Determine the components of the following TWO investigative question:
Does taking a fish-oil supplement increas the mean HDL cholesterol level compared to not taking a fish-oil supplement for people like the ones in this experiment?
Variable: Taking fish-oil & Cholesterol level
Inference: Does those who take fish-oil have a higher mean HDL cholesterol level than compared to the mean HDL cholesterol level of those not taking fish-oil?
Conclusion: For volunteers similar to the ones in the study have a higher mean HDL cholesterol level than those who do not take fish-oil. Cause and effect can be established due to this being an experiment.
An experiment claimed to show that meditation lowers anxiety proceeded as follows. The experimenter interviewed the subjects and rated their level of anxiety. Then the subjects were randomly assigned to two groups. The experimenter taught one group how to meditate; this fgroup then meditated daily for a month. The other group was simply told to relax more. At the end of the month, the experimenter interviewed all the subjects again and rated their anxiety level. The meditation group now had less anxiety. Psychologists said the results were suspect because the ratings were not blind. Explain that this means and give suggestions on how to fix the experiment.
A. The researcher has personal
A potato chip company claims that the average weight of its family-size bags is 32 ounces. A skeptical consumer organization selects a random sample of 100 Family-size bags from this company to answer the following investigative question: Is the mean weight of all family-sized bags of chips from this company less than 32 ounces? Which of the following is the parameter in this investigative question?
a. The weight of a family-size bag of chips from this company.
b.All family size bags of chips from this company
c. The average weight of all family-size bags of chips from this company
d. The average weight of the 100 randomly selected family-size bags of chips from this company.
C. The parameter is a value that represents the whole population of concern.
Wghich planet rotates the fastest? The slowest?
Jupiter is the fastest at 9 hours and 50 minutes.
Venus is the slowest at 243 days
Using the variable of how cool a grade is at Riordan
a. Make a abr graph using frequency
a. make a bar graph using relative frequency
b. make a segmented bar graph
Expected highest cool rating for seniors, going down for each grade. Bars should be disconnected.
bonus: if a segmented graph, each column should add to 100% with either the cool or uncool part shaded
A researcher is interested in the average number of contacts that older adults have in their smartphones. Here are the data on the number of contacts for a random sample of 30 adults older than age 65 with smartphones in a large city:
 a. Construct a histogram of the data
b. Are tehre any outliers? Use the IQR method.
c. What data would be best to describe the distribution? Why?
a. 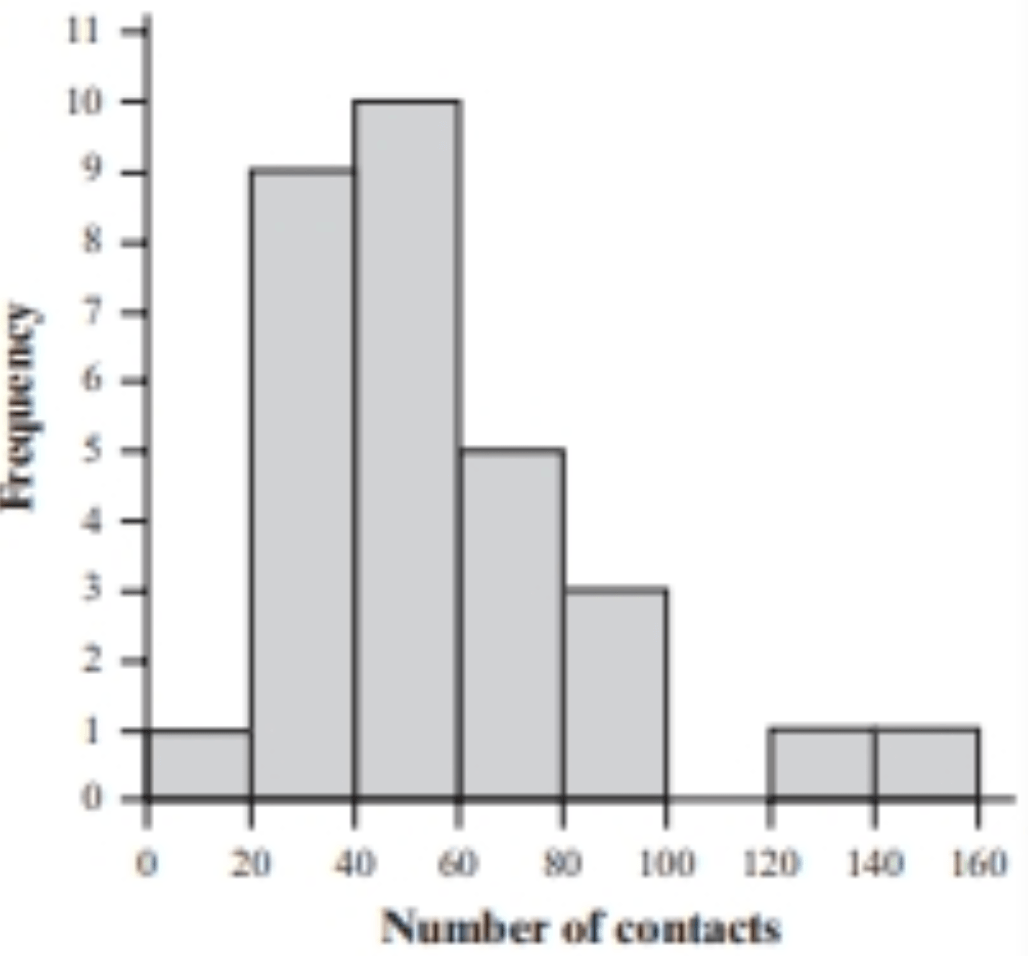 b. IQR=47, lower boundary=-40.5, upper boundary=147.5. There is one high outlier at 151.
c. Due to the data being skewed right, mean and IQR should be used instead of mean and standard deviation.
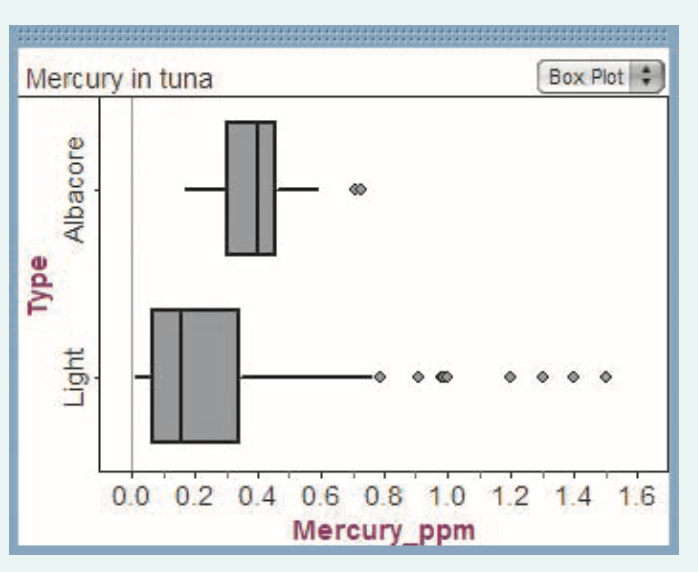
Compare these distributions using CUSS and state which type of tuna you should buy based on their mercury concentrations:
CUSS:
Center: Albacore>light
Unusual: Light has many outliers that are much more significant that Albacore (upper outliers)
Spread: Light has a much larger spread
Shape: Light is skewed right when Albacore is more symmetric
Albacore must be the right purchase. While the median is higher, it is much more reliable than the outliers represented by light tuna.
Do people get stressed out when other people watch them work? To find out, researchers recruited 30 vulunteers to take part in an experiment. Participants were timed while they completed a word search puzzle, with the researchers stsanding close by and taking notes or standing at a distance.
a. Describe a matched pairs design for this experiment
b. Explain a statistical benefit of using matched pairs instead of completely randomized design
c. Determine the investigative question for the study.
a. Make each person take both. Random which treatment goes first.
b. Matching helps reduce the variability between individuals. It would be hard to measure what were looking for to match people specifically.
c. For people, like the ones in this experiment, does having a researcher stand close by or far away affect their mean completion times of the word puzzles?
The back-to-back steam-and-leaf plot shows the lifetime of several Brand X and Brand Y batteries.
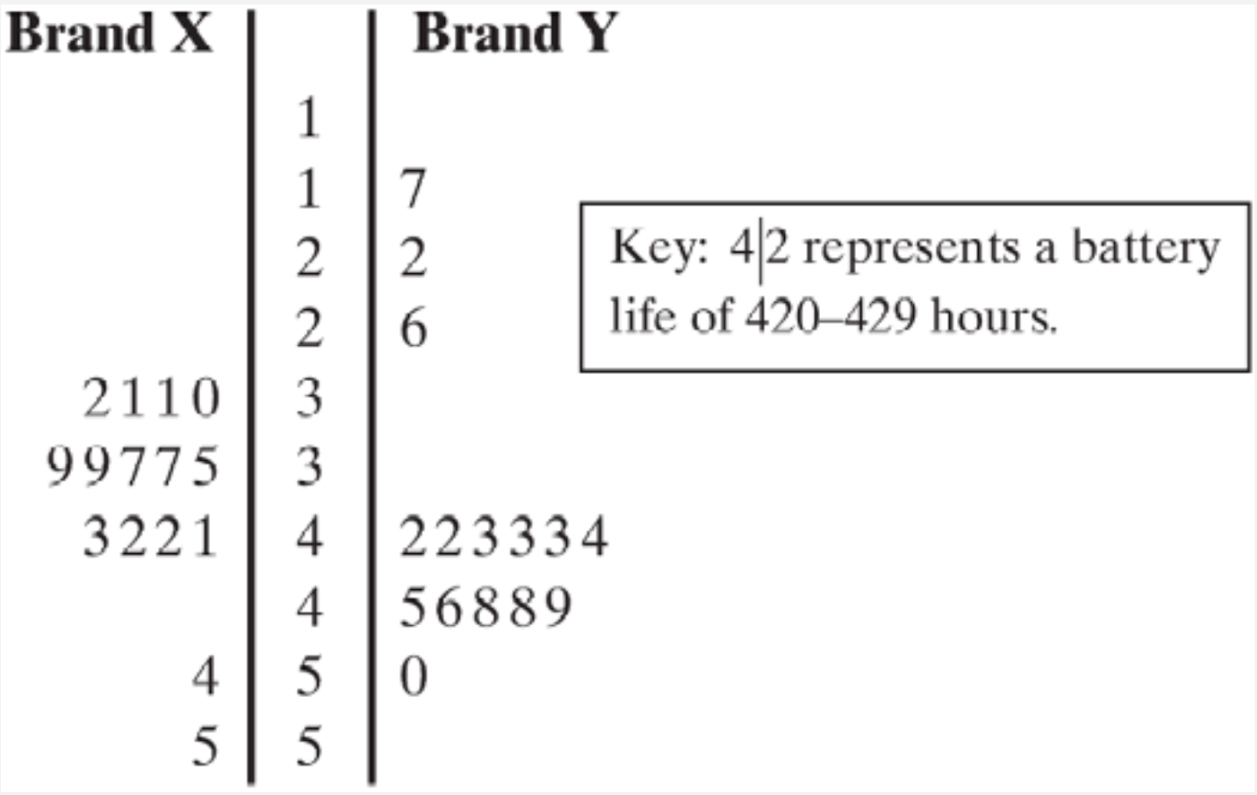 Which of the following is one reason that someone might prefer a Brand X over a Brand Y battery?
a. Brand Y had the longest lifetime
b. Brand Y batteries had the larger range of lifetimes
c. Brand Y batteries had a longer median lifetime
d. All brand X batteries had a lifetime less than 300 hours.
C.
Which bug in the animal kingdom has the most eyes?
Dragonflies