The skew direction of this graph.
What is Right Skewed?
The slope of a regression line with a correlation coefficient of r = 0.83 would be _______________. (positive/negative/zero)
What is positive?
When a point on a scatterplot has a negative residual, the predicted value is _____________ than the actual value. (higher/lower)
What is higher?
An R^2 value of 0.8532 means that _______% of the variation in one variable can be explained by the variation in the other variable.
What is 85.32%?
This is the percent of data that lies between a z-score of -1 and a z-score of 1.
What is 68%?

The value that would be greater in this graph (mean or median).
What is mean?
This is how we would describe a scatterplot with a correlation coefficient of r = 0.
What is scattered/random?
A regression equation for a scatterplot is shown below.
y = 2.5 + 8.3x
An actual value in this data set is (5, 40). This is the residual for this data point.
What is -4?
If a scatterplot has an R^2 value of 0.563, this is the value of the correlation coefficient (r).
What is 0.75?
A student surveyed her peers to determine how many hours they spend on social media each day. The mean for this data set was 3.2 hours and the standard deviation was 0.63 hours.
Amelia spends 2.5 hours per day on social media. This is her z-score.
What is z = -1.11?

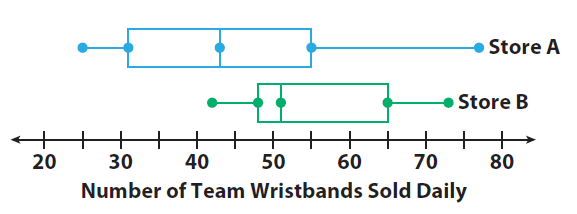
The percent of times that Store A sold 55 or more wristbands.
What is 25%
When the residual values are all very small, we say this about the strength of the association (strong/weak/moderate).
What is strong?
A residual plot looks like this in a scatterplot in which a linear model is appropriate.
What is scattered/random?
We cannot determine if a linear model is appropriate from only checking the r and R^2 values. We must also check the ____________________________.
What is residual plot?
A student surveyed her peers to determine how many hours they spend on social media each day. The mean for this data set was 3.2 hours and the standard deviation was 0.63 hours.
Lars has a z-score of 1.8. How many hours per day does he spend on social media?
What is 4.33 hours?

The IQR of Store B.
What is 17?
This is the strength, form, and trajectory of the following association:

What is strong, linear, positive?
The regression equation for a scatterplot is shown below:
y = -2.386 + 5.61 log(x)
This is the predicted value for y when x = 12.
What is 3.67?
By removing an outlier, the r and R^2 values of a scatterplot will ________________ (increase, decrease, stay the same).
This percent of data lies below a data point with a z-score of -1.
What is 15.9%?

The skew direction of the data represented in this frequency table.
What is Left Skewed?
A correlation coefficient between 0.5 and 0.8 is considered to have this kind of strength.
What is moderate?
The regression equation for a scatterplot is shown below:
log(y) = 5.121 + 2.3x
This is the predicted value for y when x = -2.
What is 3.32?
By removing a high leverage point, the r and R^2 values of a scatterplot will ________________ (increase, decrease, stay the same).
What is stay the same?
A scientist measured the heights of sunflowers in inches in the month of August. Later he converted the heights to feet. One particular sunflower had a z-score of z = 2.2 when measured in inches.
This is the z-score of the flower when measured in feet.
What is z = 2.2?