Vocab
Categorical Data
Scatterplots + Correlation
LSRL + Residuals
Influential Points and Transforming Data
100
Type of stacked bar chart where the widths of the bars are proportional to each category's size.
Mosaic Plot
100
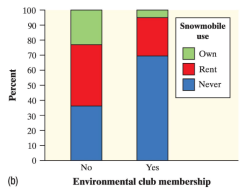 True or False? The segmented bar chart about suggests that a greater number of people that are in the environmental club have never owned a snowmobile than those who are not in the environmental club.
False, not 'number', proportion.
100
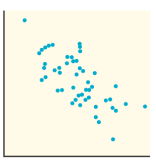
Describe the relationship in the following scatterplot.
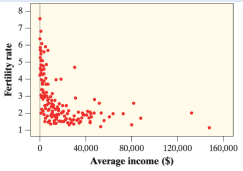
There is a moderately strong, negative nonlinear relationship between average income and fertility rate.
100
What is the formula for residuals with symbols?
Residual =y - y\hat
Red = actual - predicted
100
A data point with a very high magnitude residual compared to rest of data.
What is an outlier?
200
A ____ _____ is a data representation that uses points to represent a relationship between 2 quantitative variables.
What is scatter plot?
200
The mosaic plot below suggests that there are more people that are not in the environmental club than are. 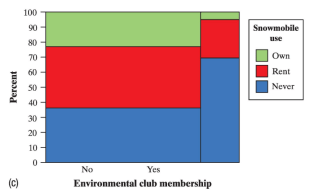
True, the width of the side that says 'No' is grater that the side that says 'Yes', therefore that is the greater sample.
200
The relationship below has a correlations coefficient of -0.37. Describe the correlation coefficient.

The correlation coefficient r= -0.37 suggests a fairly weak, negative linear relationship between average income and fertility rate.
200
Determine the equation of the LSRL based on the following computer output. 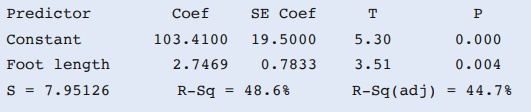
y^ = 103.4100 + 2.7469 * x
200
How would you classify Child 18? 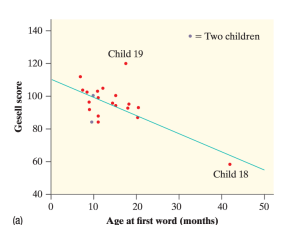
High leverage point ONLY.
300
A numerical value that quantifies the strength and direction of the linear relationship between two variables. Include the name and symbol.
What is Correlation Coefficient r?
300
Based on the Two- Way Table below, the proportion of passengers in second class 261/1207 is an examples of ____.
(Joint Relative Freq., Marginal Relative Freq., Conditional Relative Freq.)
Marginal Relative Frequency
300
Which of the following the weakest correlation?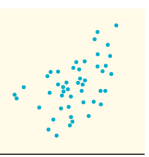
#1: Top Graph was weaker correlation
300
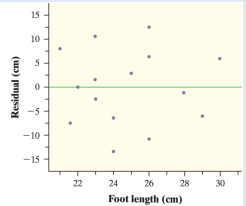 True or false, the residual plot shows that the linear model is NOT a good fit for this data. Justify.
False, the residual plot shows a random scatter about 0 which indicates a good fit.
300
What would be the best method to linearize the data if it can be modeled with y=5x^6 ?
Take the log or ln of BOTH the explanatory and response variables.
400
The different between the actual response value and the value predicted by the LSRL.
What is Residual?
400
Based on the two way table below, what proportion of the passengers that survived where in third class? What kind of relative frequency are you finding? 
151/445=0.342
This is a conditional relative frequency.
400
For a negative relationship between two variables, the coefficient of determination is 0.87, what is the correlation coefficient.
sqrt(0.87)= +-0.932
Relationship is negative so r= -0.932
400
Use the following LSRL to predict the number of shoes a person has given their age for a person that is 14 years old.
y^ = 4.5 + 1.38 * x
A person who is 14 years old is predicted to have approximately 23 shoes.
400
Given L= length in cm and Weight^ in grams
log(weight\hat)= -1.899+3.04942(log(L))
Determine the weight of a fish that is 16cm long.
Predicted weight in grams 59.265 g for fish that is 16 cm long.
500
For a scatter plot showing the relationship between attendance (x) and exam scores (y), interpret the standard deviation of residuals s= 2.57.
The actual exam scores typically differed from the exam scores predicted by the LSRL by approximately 2.57 points.
500
Based on the two way table, is there an association between the variables? Show math proof for points!
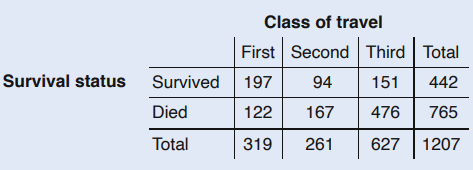
Yes, the variables are associated because their proportion distributions are different.
197/319 != 442/1207
*Answers vary
500
Interpret the value r^2 = 0.569 for relationship between arm span (x) and height (y).
56.9% of the variation in height can be explained by the linear relationship with arm span.
500
For Number of Shoes Vs Age, y^ = 4.5 + 1.38 * x
Find the residual for a person of age 10 if they actually own 12 shoes.
Res = 12-18.3= -6.3
500
Given L= length in cm and Weight^ in grams
log(weight\hat)= -1.899+3.04942(log(L))
Determine the length of a fish that weighs 100 grams.
A fish that weighs 100 grams is predicted to be approximately 19 cm tall.