Unit 7:
Sampling Distributions
(sampling)
Sampling Distributions
(sampling)
What are the 3 conditions, and what is their purpose? Be sure to identify the condition that varies by data type.
1. Random - remove bias to give accurate point estimates
2. 10% rule - sample must be less than 10% of the population so that we can ignore dependence and apply independent formulas.
3. Large Counts - For categorical np & n(1-P) greater than or equal to 10 and quantitative n must be greater than or equal to 30 (if we don't know the shape or is not approximately normal).
These conditions allow us to assume our sampling distribution is approximately Normal.
What is the formula to find an interval for categorical and quantitative data? What does each part represent?
Categorical: hatp+-z^star*sqrt((p(1-p))/n
where phat is the point estimate, zstar is the critical value and the end is the standard error.
Quantitative: barx+-t^star*s_x/sqrtn
where xbar is the point estimate, tstar is the critical value and the end is the standard error.
Whats is the 4 step process when solving a problem with a significance value?
1. Define parameter and state hypotheses
2. Determine data type and check conditions
3. Calculate necessary number summaries to find the test statistic and P-value.
4. State the evidence for alternative hyp. and whether you fail to reject of reject the null hyp. and state what this means in the context of your problem.
When do we use degrees of freedom?
1. When finding the correct critical value of a quantitative interval.
2. When finding the P-value of a quantitative interval using paper and not the calculator.
What happens to a sampling distribution as n increases for mean, standard deviation and shape?
As n increase:
1. The mean doesnt change.
2. The standard deviation becomes smaller, which makes the spread of the sampling distribution to become smaller.
3. The shape becomes more normal as n increases. We can only establish 'appoximately' normal and not 'Normal' completely.
1. What are we trying to find by creating an interval?
2. Assuming the sample size doesn't change, what happens to the interval as we increase the confidence level?
1. The true parameter associated with the population.
2. If the sample size remains the same, the interval will become larger with higher confidence levels.
1. What are the formulas for the two different test statistics?
2. What is the formula for the P-value and how is it related to the test statistic and alpha?
1. z=(hatp-p_o)/sqrt((p_o*(1-p_o))/n);t=(barx-mu_o)/(s_x/sqrtn
2. P(H_a|H_o)=Pvalue
The P-value is the area under the curve based on the test statistic. If P is greater than alpha, the alternate is not significant, but if p is less than alpha the alternate is significant.
Define the meaning of a Type I and Type II error
Type I: Reject the null hypothesis when its true.
Type I is a false negative.
Type II: Fail to reject the null hypothesis when the null hypothesis is false.
Type II is a false positive.
(Sec 7.1)Which are using unbiased estimators? Which statistic estimates the actual parameter the best?
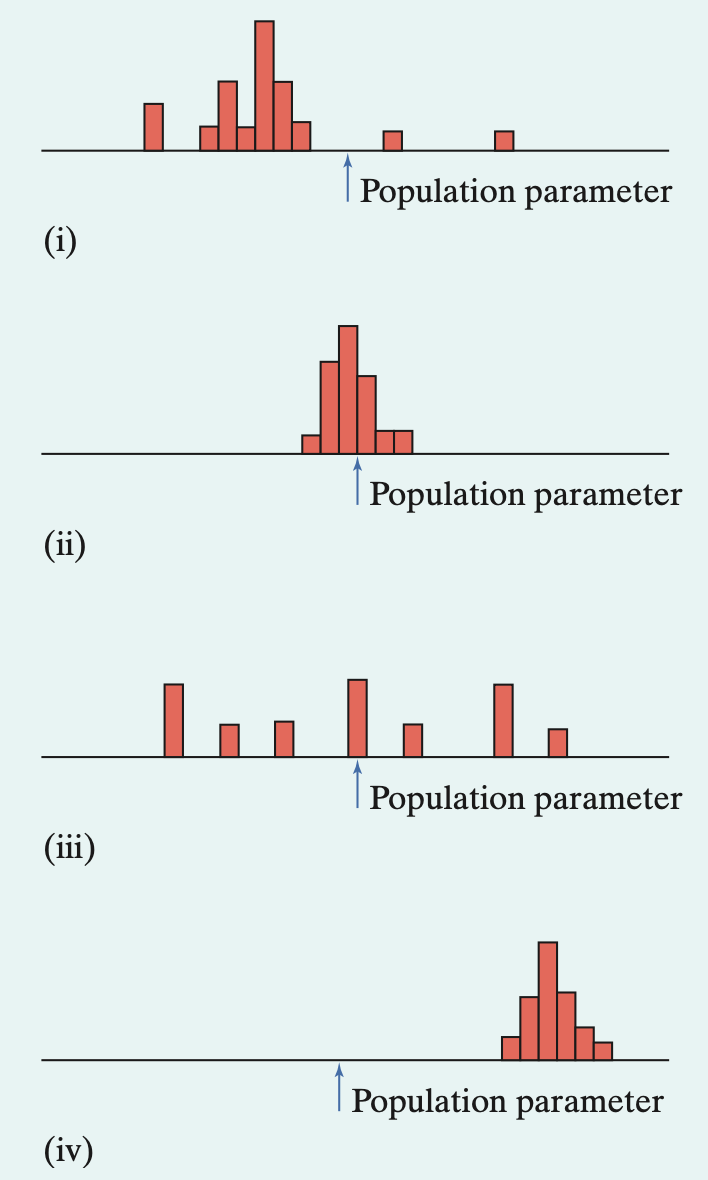
unbiased estimators: ii & iii
Best estimate: ii - since the estimator had low bias and low variability
Sec(8.1)The admissions director from a big city university found that (107.8,116.2) s a 95% confidence interval for the mean IQ score of all freshmen. Discuss whether each of the following explanations is correct.
a) There is a 95% probability that the interval from 107.8 to 116.2 contains mu
b) There is a 95% chance that the interval (107.8,116.2) contains barx
c) The interval was constructed using a method that produces intervals that capture the true mean in 95% of all possible samples
d) If we take many samples, about 95% of them will contain the interval (107.8,116.2)
e)The probability that the interval (107.8,116.2) captures mu is either 0 or 1, but we dont know which.
a) Yes. We believe that there is a 95% chance that the interval contains the population mean.
b) No. the interval does not make reference to sample results. Just that the interval contains the population mean.
c) Yes. we are 95% confident that the true mean will be within the interval using this method.
d) No. The correct phrasing would be that many samples would have an interval that has an overlap with the interval (107.8,116.2) but not necessarily containing it.
e) Yes. The population mean is either in the interval or not in the interval. There is no probability, the parameter isn't actively changing.
A change is made that should improve student satisfaction with the parking situation at your school. Right now, 37% of students approve of the parking thats provided. The null hyposthesis H_o:hatp=0.37 is tested against the alternative H_a:hatp!=0.37 .
Whats the problem with the hypotheses?
Hypotheses can only represent populations. So only
p,mu, and sigma
are acceptable measurements for hypotheses.
How are 3 ways to increase the Power of a significance test. What are we lowering the chance of at the same time?
1. Increase alpha (Type I error)
2. Increase sample size (reduce overlap between true and false null hypotheses)
3. A true null farther from the the false null. (once again, reduces overlap between the sampling distributions)
By increasing power, we are reducing the chance of a Type II error: Power=1-Type II error (called beta)
(Sec 7.2) Suppose the large candy machine has 15% orange candies. Imagine taking an SRS of 25 candies from the machine and observing the sample proportion, hatp , of orange candies.
a) What is the mean of the sampling distribution of p-hat?
b)Find the standard deviation of the sampling distribution of p-hat. Check necessary conditions.
c)Is the sampling distribution of p-hat appox. Normal? Check large counts condition.
d) What sample size would we need to be able to establish approximately normal?
a) hatp=.15
b) sigma_hatp=sqrt(((.15)(.85))/25)=0.07 25 candies is less than 10% of the total of LARGE candies in the machine.
c) 25(.15)>=10, 25(.85)>=10 No. Both of these inequalities are not greater than 10.
d) You would need a sample size of 67 to be able to establish this as approximately normal.
(sec 8.2) In January 2010 a Gallup Pool asked a random sample of adults, "In general, are you satisfied or dissatisfied with the way things are going in the United States at this time?" In all, 256 said they were satisfied and the remaining 769 said they were not. Construct and interpret a 90% confidence interval for the proportion of adults who are satisfied for how things are going.
point estimate+-z* SE
256/1025+-1.645sqrt((.25*.75)/1025)=>(.229,.274)
We are 90% confident that between .23 to .27 contains the true population proportion for adults satisfied with how things are going in the Unites States right now.
A drug manufacturer claims that less than 10% of patients who take its new drug for treating Alzheimer's disease will experience nausea. To test this claim, researchers conduct an experiment. They give the new drug to a random sample of 300 out of 5000 Alzheimer patients whose family have given informed consent for the patients to participate. In all, 25 of the subject's experience nausea. Use this data to perform a test of the drug manufacturers claim at alpha=0.05 significance level.
Use the 4-step process.
1. p: Alzheimer patients experiencing nausea after taking the new drug
H_o:p=10%, H_a:p<10%
2. Categorical data. Random: Yes; 10%, Yes; Large numbers, Yes
3.
hatp=25/300=1/12. Then: z=(1/12-.10)/sqrt((.10*.90)/300)=-0.96=>.1685
4. Since .1685 is greater than .05:
We do not have enough evidence for alt. hypothesis, so we fail to reject the null hypothesis. This means we dont believe that the drug is causing less than 10% of its patients to have nausea.
How are significance level and confidence level connected?
Which one gives us more information, a confidence interval or a significance test?
Significance level and confidence level add to 1. So if we have a 95% confidence level, we should get the same answer as a 5% significance level.
A interval is better. An interval will not only reject, or fail to reject, but also gives us an interval of plausible values for the parameter of interest.
(Sec 7.3) A study of rush-hour traffic in SF counts the number of people in each car entering a freeway at a suburban interchange. Suppose that this count has a mean of 1.5 and standard deviation of .75 in the population of all cars that enter at this interchange during rush hours.
a) Could the exact distribution of the count be normal? Why or why not?
b) Traffic engineers estimate that the capacity of the interchange is 700 cars per hour. Find the probability that 700 randomly selected cars at this freeway entrance will carry more than 1075 people. Show your work. (hint: restate this event in terms of the mean number of people per car)
a) No it cannot be normal. There must be at least 1 person to drive the car, but 2 standard deviations to the left would mean there are 0 people in the car with a standard deviation of .75.
b)With 700 cars, the expected value with a mean of 1.5 would be 700*1.5=1050 is the new mean. Standard deviation is now 700 * .75=525
P(X>1075): z=(1075-1050)/(525/sqrt700)=1.26=>10.4%
theres a 10.4% chance that more than 1075 people are in the 700 cars.
The Trial Urban District Assessment (TUDA) is a government sponsored study of student achievemtn in large urban school districts. TUDA gives a reading test scored from 0 to 500. A score of 243 is a "basic" reading level and a score of 281 is "proficient." Scores for a random sample of 1470 eight graders in Atlanta had barx=240 and sigma_barx=42.17
a) Calculate and interpret a 99% confidence interval for the mean score of all Atlanta 8th graders
b) Based on your interval, is there good evidence that the mean for all Atlanta 8th graders is less than the basic level? Explain.
a)
240+-2.58(42.17/sqrt1470) =(237.16,242.84)
b) Since a score of 243 is outside this interval range, we have evidence that the population mean of all 8th graders in Atlanta is below the "basic" level suggested by TUDA.
The one-sample t statistic from a sample of n=25 observations for the two-sided test of: H_o:mu=64, H_a:mu!=64 has the value t=-1.12
a) Find the P-value for this test using Table B AND technology. What conclusion would you draw at the 5% significance level? At the 1% significance level?
b) Redo part (a) using an alternative hypothesis of H_a: mu<64 .
1. if t=-1.12, df=24,
P-sheet: .10-.15, but two sided so .20-.30.
P-calc: .27
Neither value is significant at 5% or 1%.
2. If t=-1.12, df=24
P-sheet: .10-.15
P-calc: .14
Nether value is significant at 5% or 1%
What are the formulas that allow us to solve for the sample size for a one-sample interval? What do they have in common?
1. Categorical:
z^star*sqrt((hatp(1-hatp))/n)<=ME
2. Quantitative:
z^star*sigma/sqrtn<=ME
They share the value of a critical value being a z-score. The only exceptional to quantitative not using a t value.