Chi-Square
Inference Testing
Random Variables
Confidence Intervals
Cumulative Review
100
What test would you use to show is the data provides convincing evidence that childrens choice of snack has a different distribution for each type of ad?
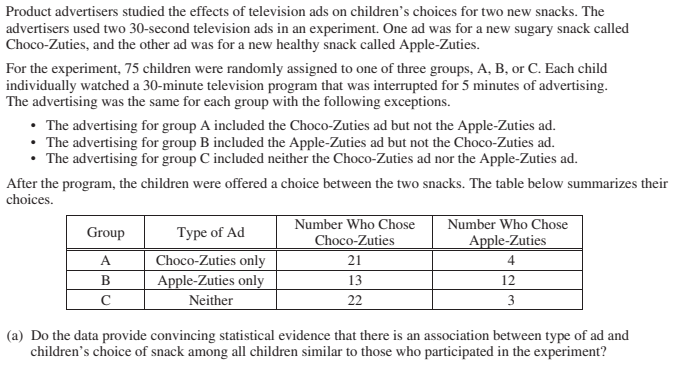
Chi-Square Test for HOM
100
A large university provides housing for 10 percent of its graduate students to live on campus. The university’s housing office thinks that the percentage of graduate students looking for housing on campus may be more than 10 percent. The housing office decides to survey a random sample of graduate students, and 62 of the 481 respondents say that they are looking for housing on campus.
What type of test should be performed to determine if the percentage of student looking for housing is greater than 10%?
1-sample z test for p
100
Which of the following is true about any discrete probability distribution of a random variable X?
A. The sum of all possible values of X is equal to 1
B. The sum of the probabilities for all possible values of X is equal to 1
C. The probability distribution is bell-shaped and symmetric
D. Approximately 95 percent of the values of X fall within 2 standard deviations of the mean
B. The sum of the probabilities for all possible values of X is equal to 1
100
How can we reduce a margin of error?
A. Increase sample size
B. Increase Confidence Level
C. Decrease sample size
D. Increase the point estimate
A. Increase sample size
100
To reduce a standard deviation of sampling distribution by half what can be done with the sample size?
A. Divide by 2
B. Multiply by 2
C. Multiply by 4
D. Add 4
C. Multiply by 4
200
How do we find out what corresponds to the component that contributes most to the chi-square statistic?
A. The largest expected value
B. The largest observed value
C. The largest chi-square component
(observed - expected)^2/(expected)
C. The largest chi-square component
(observed - expected)^2/(expected)
200
How do we interpret a p-value?
A. The probability of the null hypothesis being true
B. The probability of the alternative hypothesis being true
C. The probability of getting the test statistic as extreme or more than the value actually obtained if the null is true
D. The probability of getting the test statistic equal to the value actually obtained if the null is true
C. The probability of getting the test statistic as extreme or more than the value actually obtained if the null is true
200
A set of 10 cards consists of 5 red cards and 5 black cards. Let Y be the number of red cards you pick from 10. Which of the following is our best conclusion from this data?
A. Y has a binomial distribution with n = 10 observations and probability of success p = 0.5
B. Y has a binomial distribution with n = 10 observation and the probability of success p = 0.5, provided the deck is shuffled well
C. Y has a binomial distribution with n = 10 observation and the probability of success p = 0.5, provided after selectin a card it is replaced in the deck and the deck is shuffled well before the next card is selected
D. Y had a normal distribution with mean p =0.5
C. Y has a binomial distribution with n = 10 observation and the probability of success p = 0.5, provided after selectin a card it is replaced in the deck and the deck is shuffled well before the next card is selected
200
What is the formula for a confidence interval for means?
A. mean +- (t)(s/n)
B. mean +- (t)sqrt(s/n)
C. mean +- (t)(s/sqrtn)
D. mean +- (z)(s/sqrtn)
C. mean +- (t)(s/sqrtn)
200
What is the test-statistic for a 1 sample z-test for proportions?
A. (stat-P)/sqrt([stat*P]/n
B. (P-stat)/sqrt([P*(1-P)]/n
C. (Stat-P)/sqrt([P*(1-P)]/n
D. (P-stat)/sqrt([stat*(1-stat)]/n
C. (Stat-P)/sqrt([P*(1-P)]/n
300
How do we find the p-value for a chi-square test?
A. tcdf(LB,UB,df=n-1)
B.ncdf(LB,UB)
C. chisquarecdf(LB, UB=1000, df=(rows - 1)(columns -1 )
D. chisquare(LB,UB:1000, df = n - 1)
C. chisquarecdf(LB, UB=1000, df=(rows - 1)(columns -1 )
300
When do we have statistical significance?
A. When the p-value is less than alpha
B. When the p-value is greater than alpha
C. We don't
D. When alpha is 0.05
A. When the p-value is less than alpha
300
The probability of getting a 5 on the stats exam is 17%. Assume each student is independent of one another. What is the probability that 4 randomly chosen students all receive less than a 5 on the AP Stats exam?
A. 0.9992
B. 0.5254
C. 0.4746
D. 0.0008
C. 0.4746
300
What is the margin of error for a confidence interval for a difference in means?
A. (t*) sqrt(S_1/n_1+S_2/n_2
B. (z*) sqrt(S_1/n_1+S_2/n_2
C. (t*) sqrt(S_1^2/n_1+S_2^2/n_2
D. (z*) sqrt(S_1^2/n_1+S_2^2/n_2
C. (t*) sqrt(S_1^2/n_1+S_2^2/n_2
300
If we reject Ho but Ho is true, what is this?
A. Type I error
B. Type II error
C. Alpha
D. Type I and Type II error
A. Type I error
400
What is the degrees of freedom for inference for means?
A. n
B. n - 1
C. n - 2
D. n + 1
B. n - 1
400
Simon's lawnmower has a probability of 0.3 of starting any time he pills the starter cord. Which of the following described the probability that Simon's lawnmower starts exactly 1 time out of 5 pulls?
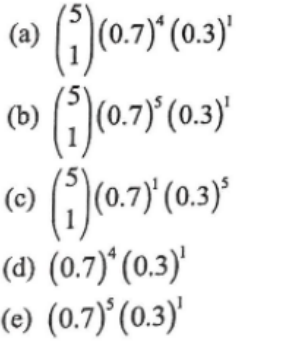
(a)
400
What is the margin of error for a confidence interval for a 2 sample z test for proportions?
A. z* sqrt([P_1(1-P_1)]/n_1+[P_2(1-P_2)]/n_2]
B. t* sqrt([P_1(1-P_1)]/n_1+[P_2(1-P_2)]/n_2]
C.z* sqrt([P_1(P_2)]/{n_1n_2}
D. t*
sqrt([P_1(P_2)]/{n_1n_2}
A. z* sqrt([P_1(1-P_1)]/n_1+[P_2(1-P_2)]/n_2]
400
70% of Mike's tosses are ringers when he plays horseshoes. If He tosses 50 horseshoes what is the approximate probability that less than 68% of them will be ringers? Use normal approximation to solve the problem.
A. 0.3773
B. 0.4308
C. 0.5692
D. 0.6227
A. 0.3773
Sampling Distribution for proportions
Mean = p
SD =
sqrt((p(1-p))/n
500
How do we find p-value for a significance test for means If Ha: mean > Ho
A. normalcdf(LB: test stat, UB: 1000)
B. tcdf(LB: test stat, UB: 1000, df: n - 1)
C. tcdf(LB: -1000, UB: test stat, df: n - 1)
D. normalcdf(LB: -1000, UB: test stat, df: n - 1)
B. tcdf(LB: test stat, UB: 1000, df: n - 1)
500
 Describe the distribution of the sample mean score if 30 students were randomly chosen.
A. exactly normal, mean 68.5, standard deviation of 15.4
B. approximately normal, mean 68.5, standard deviation of 0.513
C. approximately normal, mean 68.5, standard deviation of 2.812
D. approximately normal, mean 68.5, standard deviation of 15.4
C. approximately normal, mean 68.5, standard deviation of 2.812
500
How do we find p-value for a significance test for difference of means If Ha: mean not equal Ho and stat mean 1 > stat mean 2
A. tcdf(LB: test stat, UB: 1000)
B. tcdf(LB: test stat, UB: 1000, df: n - 1) x 2
C. tcdf(LB: -1000, UB: test stat, df: n - 1) x 2
D. tcdf(LB: -1000, UB: test stat, df: n - 1)
B. tcdf(LB: test stat, UB: 1000, df: n - 1) x 2