Types of Data
Graphs/Displays
CUSS
Study Design
Miscellaneous
Final Jeopardy
100
This type of variable places individuals into groups or categories (not numerical)
What is a categorical variable?
100
What are two different ways to represent one categorical variable graphically?
bar chart, pie chart, there's probably another one that I'm forgetting but that I would count correct
100
The 4 main features of a distribution are...
What is center, unusual points/outliers, shape, and spread
100
When doing an observational study, why is it important to use randomization when selecting a sample?
To reduce bias
100
What is a parameter?
A value associated with the population
200
This types of variable takes numerical values and measures quantities.
What is a quantitative variable?
200
When would you use a mosaic plot?
When comparing two categorical variables (you could get more specific with this, but this is is enough for me to count this correct)
200
a distribution with a longer tail on the right is described as...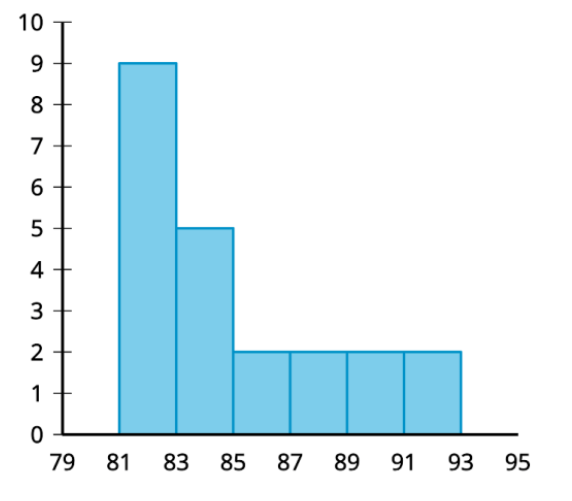
what is skewed right?
200
this type of bias occurs when some members of a population are less likely to be chosen
what is undercoverage bias?
200
What is the difference between frequency and relative frequency?
Frequency is how many occurrences of a data point there are. Relative frequency is the percentage of all data points in the sample that fit into the category in question.
300
A survey asking students for their favorite sports team collects this type of data
what is categorical data?
300
What are the components of the 5 number summary? (used to graph a box plot)
Minimum, Q1, Median, Q3, Maximum
300
Is the mean or median of this distribution higher? (no calculations necessary)
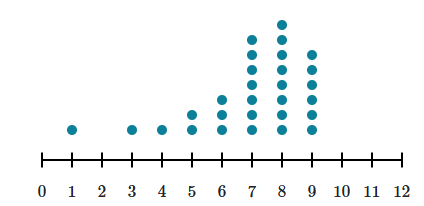
Since it is left skewed, the mean is pulled left, so the median is higher than the mean
300
A football coach wants to know how long it takes CMS students to run a mile on average. They decide to take a random sample of 50 students from every grade level 5-12 (50 5th graders, 50 6th graders, etc.). This is an example of which type of random sampling?
Stratified random sample
300
When conducting an experiment, why is it important to randomly assigntreatment?
To be able to imply causation, or to reduce confounding.
400
Height measured in inches is an example of this kind of quantitative variable
what is continuous data?
400
How would I find the joint relative frequency of students in this class who are drivers and like watching TV/Movies?

Students who matched both divided by total students in study, so 3/18
400
CUSS With context!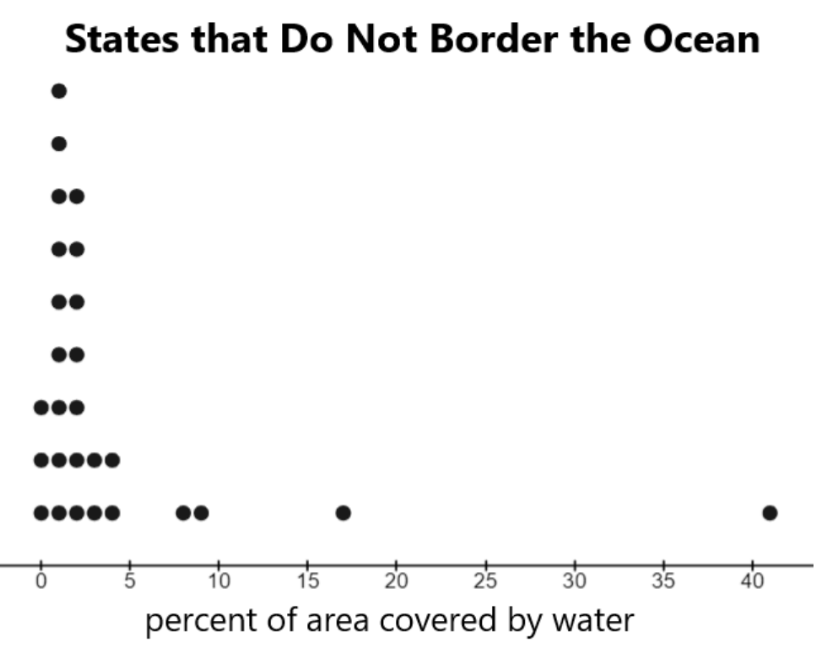
The median percentage of area covered by water within states that do not border an ocean is about 2.5%, there is an outlier which is over 40% covered by water, the distribution is skewed to the right, and the IQR is only about 3-5 whereas the range is above 40.
400
If you had a list of 1000 people and wanted a sample of 100 of them, how could you use a systematic random sample to select your sample?
Use a random number generator to get an integer 1-10. Select that person and every 10th person after them.
400
Who's this guy?

That's Phil (or Philoctetes)
500
The number of siblings a student has is this kind of quantitative variable
what is discrete data?
500
How do you determine if a data point is an outlier in a set of quantitative data? (there are 2 ways, I'll take either one)
1.5 IQR's above Q3 or below Q1
or 2 Standard Deviations above or below the mean
500
CUSS and compare with context!
A school has a toy drive in which students bring in toys to be donated to charity. The number of toys donated by juniors and seniors are summarized in the histograms. Both distributions have a mean of 5 toys.
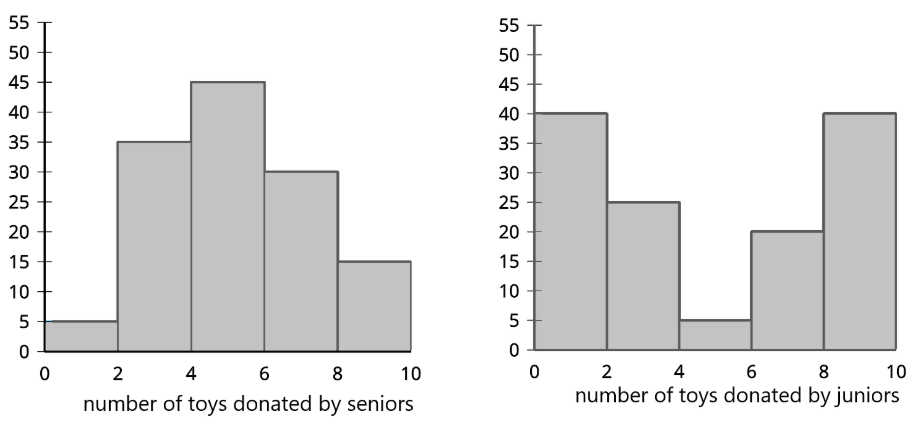
The seniors and juniors donated the same amount of toys on average, but the standard deviation of of the toys donated by the juniors was much higher. Both distributions were fairly symmetrical, but the toys donated by seniors is unimodal with a peak around 5 and the toys donated by juniors is bimodal with peaks at 0 and 10. There are no outliers in either distribution.
500
A student wants to test whether or not bribing her teachers causes her grades to go up. For each of her different teachers, she flips a coin. For the teachers that got heads, she works normally during first quarter and starts giving them candy every day second quarter. For teachers that got tails, she starts giving them candy every day first quarter and stops second quarter. She then compares her grades in the normal quarter and the bribery quarter for each teacher. This is an example of what experimental design?
Matched pairs design
500
Which components is this investigative question missing?
For all similar acne patients, is the new drug more effective than the old drug?
Parameter, response variable, and conclusion are missing. Corrected question:
For all similar acne patients, does the new drug cause an improvement in mean acne severity compared to the old drug?
500
What is a z-score?
A measurement of how many standard deviations a data point is from the mean within a sample