Vulgar Language
Boxplots, Outliers, Snake Oil, whatever you want!
Don't "Deviate" by Being "Mean"
CUSSing in Action
Keeping Up With Old News
100
CUSSing is one of the great American past times, right next to baseball. The "U" in CUSS stands for...
Unusual Features
100
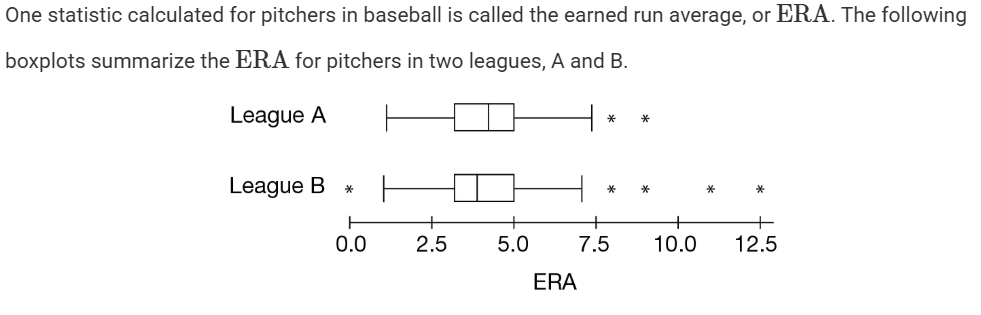
Name which of the following statistics is the same for both leagues.
Range
IQR
Median
Maximum
IQR
100
Describe in words how to calculate the mean of a set of data.
Give the symbol/variable that represents the mean of a sample.
Add all data values together and then divide by the total number of value in the data set.
bar x
100
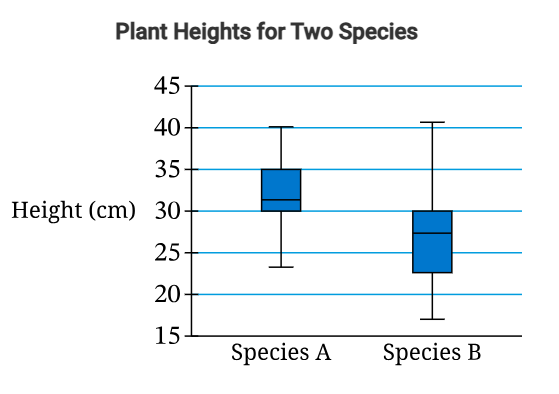
Compare the center of the distribution of plant heights for species A and B.
The median plant height of Species A is 31 cm which is higher than the median height for species B of 27 cm.
100
Kristen is investigating the opinions of students at her high school on the new school hours proposed by the school board. Determine which of the following is her population of interest.
A) All members of the school board
B) All teachers at her school
C) All students at her high school
D) All students in the school district
C) All students at her high school
200
When describing any distribution, it is imperative that you CUSS. The "C" in CUSS stands for...
Center
200
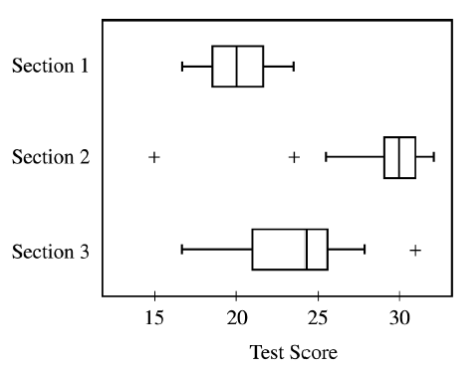
Make a statement regarding the top 75% of test scores in Section 2 compared to all test scores in Section 3.
The top 75% of test scores in Section 2 are higher than all of the test scores in Section 3.
200
The Standard Deviation measures...
The typical distance of the values in a distribution from the mean
200
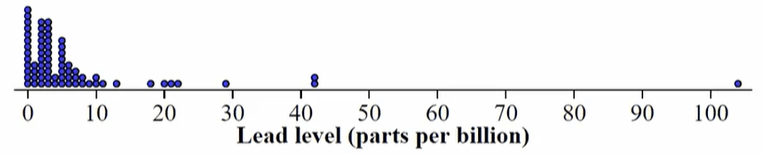 Describe the spread of the distribution.
The values range from 0 parts per billion of lead up to about 105 parts per billion of lead.
(The values range from 0 parts per billion of lead up to about 42 parts per billion of lead and an outlier at 105 parts per billion of lead)
200
A randomized block design will be used in an experiment to compare two lotions that protect people from getting sunburned. Determine which of the following should guide the formation of the blocks.
A) Participants in the same block should receive the same lotion.
B) Participants should be randomly assigned to the blocks.
C) Participants within each block should be as similar as possible with respect to how easily they get sunburned.
D) Participants within each block should be as different as possible with respect to how easily they get sunburned.
C) Participants within each block should be as similar as possible with respect to how easily they get sunburned.
300
When CUSSing, one must always be aware of both S's and not to simply say "CUS" but fully pronounce "CUSS". The two "S"'s in CUSS stand for...
Shape
Spread
300
The two rules/ways to calculate outliers are...
1.5 x IQR Rule
2SD Rule (2 x Standard Deviaition)
300
True or False: The mean is resistant to extreme value such as outliers.
False
300
Describe the shape of the distribution.
The distribution of lead levels is unimodal and skewed right
300
The president of a small company needs to collect data on the educational background of all 20 of the company’s employees. Determine which of the following is the best method to use for data collection.
A) Census
B) Cluster Sample
C) Simple Random Sample
D) Stratified Sample
A) Census
400
Any good AP Stats teacher will emphasize how important that a student BS their way through the class to receive a good score. To "BS" means to...
Be Specific
400
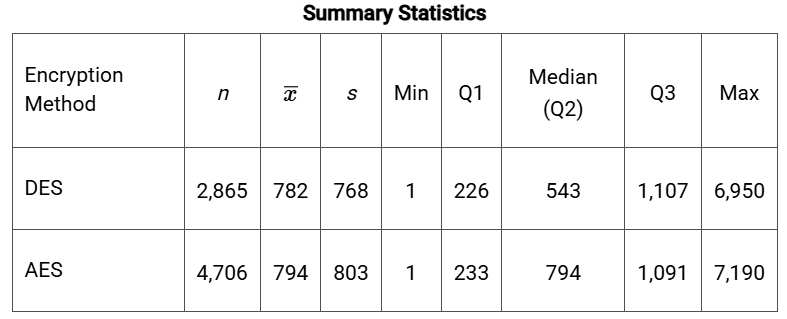
Determine whether there are outliers using the 1.5 x IQR rule for the AES encryption method.
For the AES method, 1.5 × IQ is 1.5 ⋅ (1, 091 − 233) = 1, 287. There are no lower outliers because 233 − 1, 287 = −1, 054 and the minimum number is 1. There are upper outliers because 1, 091 + 1, 287 = 2, 378 and the maximum is 7,190.
400
The graph for __________ displays data for level of interest with the least standard deviation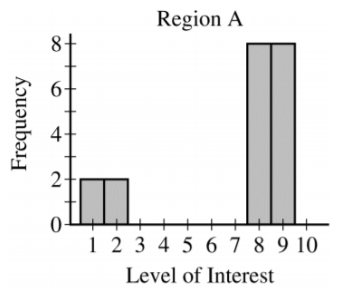
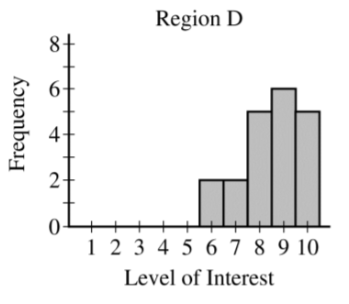
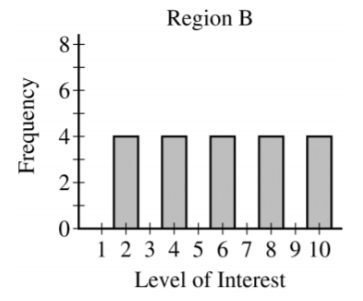
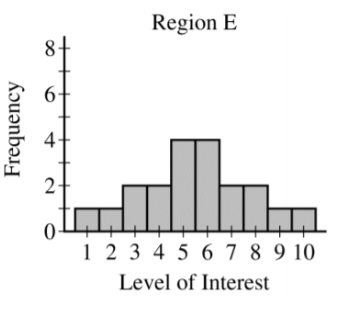
Region D
400

Compare the variability in plant heights between species A and B.
The variability (IQR) for Species A, (35 − 30 = 5 cm), is less than the variability (IQR) for Species B, (30 − 23 = 7 cm).
OR
The variability (range) for Species A (about 16 or 17 cm), is less than the variability for Species B (about 23 or 24 cm).
400
An experiment was conducted to assess the effect of baking temperature on the density of bread. A large batch of white bread dough and a large batch of whole wheat bread dough were prepared. Each of the batches was formed into 18 loaves, resulting in a total of 36 loaves. Each of the white bread loaves was randomly assigned to one of three baking temperatures (low, medium, and high), so that 6 loaves were baked at the low temperature, 6 were baked at the medium temperature, and 6 were baked at the high temperature. A similar process of random assignment was carried out for the whole wheat bread loaves.
Determine which of the following are the treatments in the experiment.
A) The 36 loaves of bread
B) The type of bread (white, whole wheat)
C) The density of the bread
D) The baking temperatures (low, medium, high)
D) The baking temperatures (low, medium, high)
500
This thief of joy is important to avoid in life when thinking about oneself and others. However, it must be done when given something like a back-to-back stem and leaf plot or two boxplots overlayed. Then, it becomes important to ___________ while you CUSS for both distributions.
Compare
500

The teacher finds a test that is not labelled for the section it belongs to. Suppose the test score is a 26. Identify the likely Section the test belongs in based on the BoxPlots.
Since the highest value of Section 1 is 23, it can't belong to 1. Although the lowest test score (excluding outliers) of Section 2 is 26, the likelihood of the test being the lowest score is unlikely. Instead, it's likely Section 3 since the value of Q3 (the middle of the top 50%) is 26 making it a score that is not one of the extremes.
500
Based on the histogram below, the mean of the distribution would be (lower, about the same, or higher) than the median. Explain how you know.
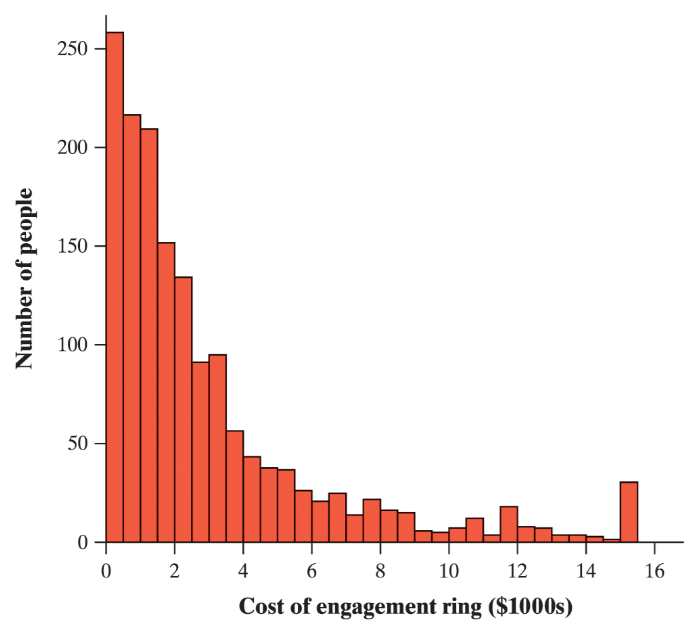
Higher because the shape of the distribution is skewed right.
500
The data show the summary statistics of commute times (in minutes) of two areas.
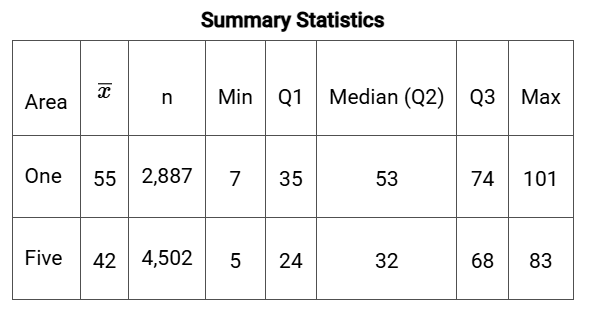
Use comparisons of the summary statistics in the table to describe the most likely shape for the distribution of commute time in Area Five.
The mean (42) is larger than the median (32), which suggests that the distribution of commute time for Area Five is likely right-skewed.
500
An agricultural scientist wanted to compare the effect of a new fertilizer to that of three older fertilizers—X, Y, and Z—on the growth of vegetables typically grown in small gardens. Two hundred green bean seedlings were individually planted in identical pots and randomly assigned to one of four groups of 50 each. Seedlings in one group were given the new fertilizer, and the three remaining groups of seedlings were given fertilizers X, Y, or Z, respectively. At the end of four weeks, all seedlings were dried and weighed. The scientist found that the mean weight of the seedlings in the group given the new fertilizer was significantly greater than the mean weights of seedlings in the other three groups. The scientist concluded that the new fertilizer was more effective than the other fertilizers for all vegetables.
Determine why is the scientist’s conclusion not appropriate.
A) The study was observational, so cause and effect cannot be concluded.
B) The experiment only included green beans, so the results cannot be generalized to all vegetables.
C) The experiment did not group the seedlings into blocks by the variety of beans.
D) The experiment lacked a control group that did not use any fertilizer.B) The experiment only included green beans, so the results cannot be generalized to all vegetables.