Sec 2A - Relationships between Categorical Variables
Sec 2B - Randomness, Probability and Random Events
Sec 2B - Randomness, Probability and Random Events
GTiven the two-way table: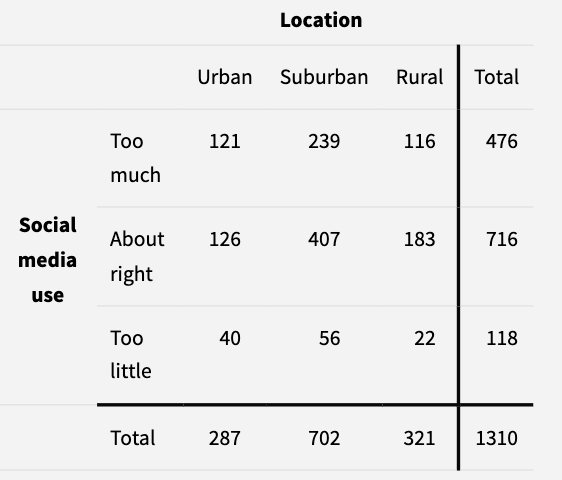
a. What proportion of students live in an urban location and said 'too much' or 'about right'?
b. What percentage of urban students said they use social media too much? Suburban students? Rural students?
a. P( U and T or U and A.R)=121/287+126/287=247/287
b.
P(U and T.M.)=121/287, P(S and T.M.)=239/702, P(R and T.M.)=116/321
Human blood types can be type O, A, B or AB, but the disitrbution of the types varies by race. Here is the distribution of blood type among Black people in the United States:
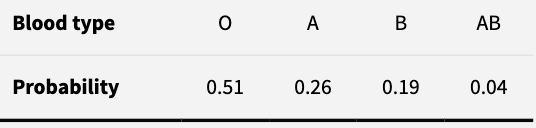
a. Explain why this is a valid probability model
b. Find the probability that the person does not have type B blood.
a. All the probabilities for the outcomes add to 1.
b. P(not B)=1- p(B)=1-.19=0.81
Theres an 81% probability that a randomly chosen black person in the United States does not have type B blood.
A small car ferry runs every half-hour from one side of a large river to the other. The ferry can hold a maximum of 5 cars, and the charge is $5 per car. The probability distribution for the random variable Y=money collected on a randomly selected ferry trip is shown here:

a. Find P(Y>10). Describe this probability in words.
b. Write the event "at least $10 is collected" in terms of Y. What is the probability of this event?
a. P(Y>10)=0.16+.027+0.42=0.85
Theres an 85% probability that any random ferry run makes more than $10.
b. P(Y>=10)=0.08+0.16+0.27+0.42=0.93 Theres a 93% probability that any ferry run makes at least $10 dollars.
The distribution of weight for male black bears in a large geographic region is approximately normal with a mean of mu=250 pounds . About 99.7 of these bears have weights between 130 and 270 pounds. Find the standard deviation of the distribution.
If they hold 99.7% of data, they are both 3 standard deviations away from the mean. Therefore, 370-250=250-130=120 and 120/3 =40.
The standard deviation of these black bears is 40 pounds.
Tree diagrams can organize problems having more than two stages. The following figure shows probabilities for a charity calling potential donors by telephone. Each person called is either a recent donor, past donor, or a new prospect. At the next stage, the person called either does or does not pledge to contribute, with conditional probabilities that depend on the donor class to which a person belongs. Finally, those who make a pledge either do or do not actually contribute. Suppose we randomly select a person who is called by the charity.
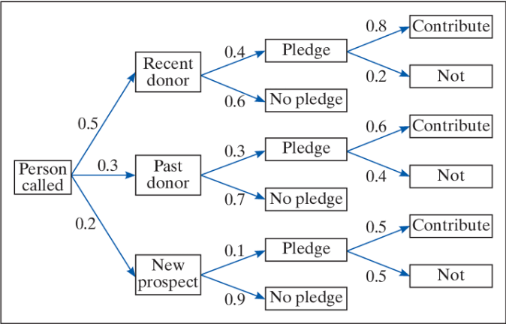
a. What is the probability the person contributed?
b. Given that the person contributed, find the probability they are a recent donor.
a. 3 paths that end with contribution
P(C)=.5*.4*.8+.3*.3*.6+.2*.1*.5=0.224
Theres a 22.4% probability that one of the people called will contribute.
b. P(R|C)=(P(R andC))/(P(C))=(.5*.4*.8)/.224=.714
Theres a 71.4% probability that if the person contributed that they are a recent donor.
The figure shows the results of a basketball player attempting many 3-point shots:
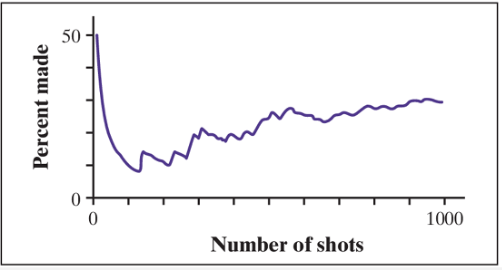
a. Explain what this graph tells you about random behavior in the short run and the long run.b. We can use the overall percentage of made shots to estimate this players probability of making a 3-point shot. Is this value an empirical probability of a theroretical probability? Explain your answer.
a. Probabilities in the short term are volatile and can change. Probabilities are only understood in the long run (Law of large numbers) so we can actually see the chance process show the actual probability of an event.
b. This is empirical as we have applicable data that came to this conclusion, not just a simulation.
Suppose we choose a U.S. adult ages 25 to 29 at random. The probability is 0.065 that the person chosen did not complete high school, 0.290 that the person has a high school diploma but no further education and 0.387 that the person has at least a bachelors degree.
a. What is the probability that the person has some education beyond high school, but does not have a bachelors degree?
b. Find the probability that the person has at least a high school education. Which probability rule did you use to find the answer?
c. Find the probability that the person has further education beyond high school. Which probability rule did you use to find the answer?
a. P(Further education but no degree)=1-(0.065+0.290+0.3857=0.258 (complement rule)
There's a 25.8% probability that a randomly chosen U.S. adults between 25-29 years old has further education, but no degree.
b. P(At least a high school education)=1-P(no education)=1-0.065=.935 (complement rule)
There's a 93.5% probability that a randomly chosen U.S. adults between 25-29 years old has a high school education
c. P(Further education)=0.258+0.387=0.645
This is due to the events being mutually exclusive.
There a 64.5% probability that a randomly chosen U.S. adults between 25-29 years old has further education.
An online spinner has two colored regions- blue and yellow. According to the website, the probability that the spinner lands in the blue region on any spin is 0.80. Assume for now that this claim is correct. Suppose we spin the spinner 12 times and let X= the number of spins that land in the blue region.
a. Explain why X is a binomial random variable
b. Find the probability that exactly 8 spins land in the blue region.
a. B - yellow or blue, I - Each spin is independent, N - 12 spins, S - p(s)=0.80
b. P(X=8)=(12/8)(0.80)^8*(0.20)^4 DO NOT WRITE 12C8 AS A FRACTION!!! I had to cheat with this program.

Theres a 13.3% probability of getting exactly 8 spins in the blue region.
A study of 12,000 able bodied students at the University of Illinois found that their times for the mile run were approximately normally distributed with mean 7.11 and standard deviation 0.74 minute. Suppose we choose a student at random from this group. We are interested in the probability that the students mile run time is less than 6 minutes.
Find the probability that the randomly selected students run time is less than 6 minutes.
-make your darwing with mean and x of concern and shade left
ncdf(-10000,6,78.11,0.74)

Theres a 6.7% probability that a runner chosen at random has a run time under 6 minutes.
Thousands of travelers pass through the airport in Guadalajara, Mexico each day. Mexican customs agents want to be sure theat passengers are not bringing illegeal items, ut do not have time to search every traveler's luggage. Instead, customs requires each person to press a button. Either a red bulb or a green bulb lights up. If the light is red, the passenger will be searched by customs agents. Green means 'go ahead'. Custom agents claim that the light has a probability of 0.30 of showing red on any push of the button. Assume for now that claim is true.
Suppose we watch 20 passengers press the button. Let R=the number who get a red light
a. What probability distribution does R have? Justify your answer.
b. Find the probability that at most 3 people out of 20 would get a red light if the agent' claim is true.
c. Suppose that only 3 of the 20 passengers get a red light after pressing the button. Does this give convincing evidence that the customs agents' claimed value of p=0.30 is too high? Explain your reasoning.
a. R is a binomial distribution. B - red of green, I - each press is independent, N - 20 passengers, S - P(s)=0.30
b. P(X<=3)=(20/3)(.3)^3*.7^13
binomcdf(20,.3,3)=0.107
Theres a 10.7% probability of getting 3 or less red lights out of 20 presses of the button.
c. No. 10.7% is not rare, so we do not have convincing evidence that the customs agents claim is wrong.
Researchers want to investigate whether a majority of students at the local 4-year college reguarly recycle. To find out, they survey an SRS of 100 students aat the college about their recycling habits. Suppose that 55 students in the sample say that they regularly recycle. Is this convincing evidence that more than half of all students at the college would say they regularly recycle? The dotplot shows the results of taking 200 SRSs of 100 students from a population in which p=0.50.
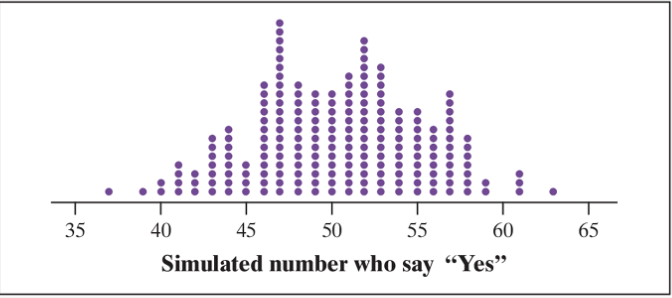
a. Explain why the sample results of 55 students does not give convincing evidence that a majority of the college's students would say that they regularly recycle.
b. Support instead that 63 students in the researchers sample had said 'yes'. Explain why this result would give convincing evidence that a majority of the college's students would say that they regularly recycle?
a. A proportion of 55/100 is an expected result given p=0.50. This is not evidence against their claim.
b. 63/100 or greater only happened once in 100 SRSs of the college's students. This means that it is likely that the parameter is higher than .50 as 63/100 is incredibly unlikely to get by chance from the parameter 0.50.
In one large city, 40% of alll households have own a dog, 32% own a cat and 18% own both. Suppose we randomly select a household that pwns a cat. Find the probability the house also owns a dog.
P(D|C)=(P(D andC))/(P(C))=0.18/0.32=0.5625
Theres a 56.25% probability a household owns a dog given they have a cat.
In the game of Scrabble, the first player draws 7 letters at random from a bag containing 100 tiles. There are 42 vowels, 56 consonants and 2 blank tiles in the bag. Anise draws first and is surprised to discover that all 7 tiles are vowels. Let Y= the number of vowels in a random sample of 7 scrabble tiles. We would like to find P(Y=7)
a. Explain why the independent condition for a binomial setting is not met.
b. Is the 10% condition met? Justify your answer.
a. When drawing out of bag in scrabble, it is done without replacement. So the drawings of the scrablle letters is NOT independent.
b. Due to the bad having 100 pieces, 7 drawn pieces is less than 10%, so the condition is met and we are allowed to ASSUME independence.
The distribution of height for the NBA players is appriximately normal with a mean of 78.4 inches. If 5.7% of players have height greater than 84 inches, calculate the standard deviation of the distribution.
Need z to find standard deviation

1.58=(84-78.4)/sigma
sigma=3.54 inches
Reseachers in Norway analyzed data on the birth weights of 400,000 newborns over a 6-year period. The distribution of birth weight is approximately normal with a mean of 3668 grams and a standard deviation of 511 grams. babies who weigh less than 2500 grams at birth are classified as 'low birth weight.'
a. What proportion of newborns would be identified as low birth weight?
Find the 80th percentile of the distribution of birth weight.
a. normalcdf(-10000,2500,3668,511)

Approximately 1.1% of babies would be classified as low birth rate.
b. InvNorm(0.80,3668,511,LEFT)=

A baby weighing 4098.07 grams would be considered the cutoff for the 80th percentile.
If I toss a fair coin 5 times and the outcomes are TTTTT, what is the probability that tails occurs on the next toss?
a. 0.5, b. less than 0.5, c. greater than 0.5, d. not enough information
a. The coin has no memory of what happened on the previous tosses. It is independent.
Employees at a local coffee shop recorded the drink orders of all the customers on a Saturday. They found that 64% of customers ordered a hot drink, and 90% of these customers added cream to their drink. Find the probability that a randomly selected Saturday customer ordered a hot drunk and added cream to the drink.
P(C|H)=(P(C andH))/(P(H))->
P(H)*P(C|H)=P(C andH)->
0.64*0.80=P(C andH)=0.512
The probability a customer orders a hot drink and adds cream is 51.2%.
An automated machine that fills water bottles has a 0.01 oribability of overfilling each bottle. Suppose that 200 bottles are filled by this machine.
What is the probability that the machines overfills at least 5 bottles?
Binomial setting passed
P(X>=5)=1-P(X<=4)
 Theres a 5.1% probability that the machine overfills at least 5 bottles.
A study of the health of teenagers plans to measure the blood cholesterol level of an SRS of 13 to 16 year-olds. The researchers will report the value of the sample mean as barx as a point estimate of the measn cholesterol level mu in this population. Explain to someone who knows little about statistics what it means to say that barx is an unbiased estimator of mu .
barx is an unbiased estimator of mu given that it is not a biased sample. Due to the nature of the sample being an SRS, this gives the point estimate barx a fair chance to be a good 'impostor' for the parameter mu
2G #23
In a residential neighborhood, the distribution of house values is unimodal and skewed to the right with a median of $200,000 and an IQR of $100,000. For which of the following sample sizes, n=10 or n=100, is the sample median more likely to be greater than $250,000? Explain your reasoning.
The n=10 is more likely to have a median greater than $250,000. This is because the smaller sample size will increase the variability of the distribution, causing the sampling distribution to contain more values, therefore having a higher range than the sample size of n=100.
If there is no association between grade level and handedness for the members of the sample, which of the following is the correct value of x?
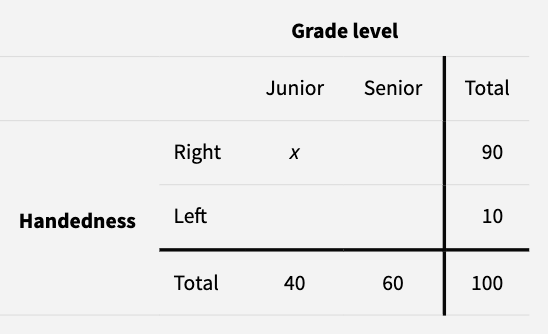
A. 20, B. 36, C. 45, D. Impossible to determine
B
To find the value:
x=(row total*column total)/grand total
x=(40*90)/100=3600/100=36
Suppose a loaded die has the following probability distribution:
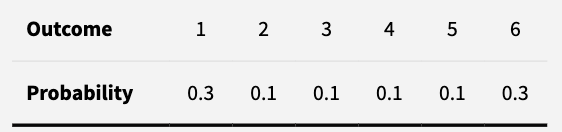 if this die is thrown and the top face shows an odd number, what is the probability that the die shows a 1?
a. 0.17, b. 0.30, c. 0.33, d. 0.60
P(1|Odd)=(P(1 and Odd))/(P(odd))=0.30/0.50=0.60
There a 60% probability of getting a 1 given the die has rolled an odd number.
Whats the expected number of cars in a randomly slected U.S. household?

a. 1.00, b. 1.08, c. 1.75, d. 2.00
Multiply each outcome by its associated probability.
mu_X=0*.9+1*.36+2*.35+3*.13+4*.05+5*.02
c. 1.75
The weights of laboratory cockroaches can be modeled with a normal distribution having mean 80 grams and standard deviation 2 grams. The following figure shows the normal curve for this distribution of weight.
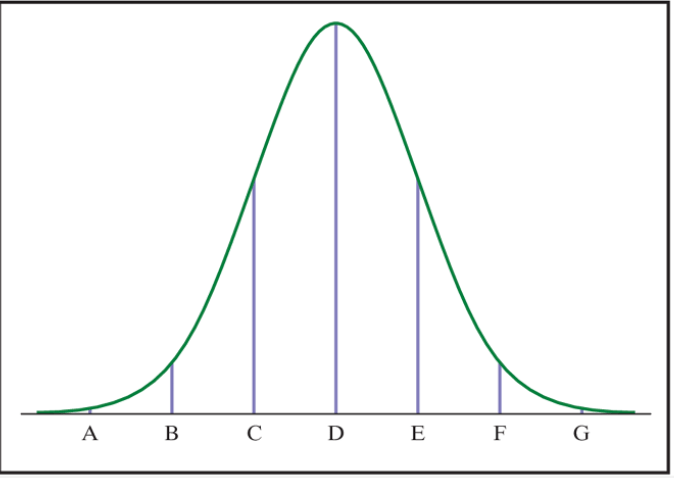
Point C on this normal distribution correcponds to?
a. 74 g, b. 76 g, c. 78 g, d. 82 g
c. 78. Its one standard deviation to the left of the mean, 80-2=78
The figure shows the probability distribution of a discrete random variable X. Which of the following best describes this random variable?
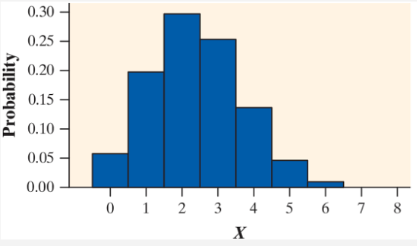
a. Binomial with n=8, p=0.1
b. Binomial with n=8, p=0.3
c. Binomial with n=8, p=0.8
d. Approximately normal with mu=2.5 and sigma=1.1
b. The expected value is 2.4 with a standard deviation near 1.3.
This matches peak and spread of the data better than the other options.