This variable, plotted on the x-axis, may help predict or explain changes in another variable.
Explanatory Variable
In a study conducted on the time reviewing for the Unit 3 Exam and Student Scores, Mr. Nations calculates the correlation coefficient (r) to be 0.867. Interpret the correlation coefficient.
The linear relationship between Time studying for the Unit 3 Exam and Student Scores is positive and very strong.
hat y = a+bx
Residual = Actual y - Predicted y
OR
Residual = y - haty
What is the formula for calculating the slope (b) using correlation (r) and the standard deviations of x and y?
b = r*s_y/s_x
This variable, plotted on the y-axis, measures the outcome of a study.
Response Variable
A student reports the correlation between a hiker's distance and time is r = 0.9 meters. What is wrong with this statement?
Correlation has NO UNITS!
What is the part of the LSRL that is the predicted value of y when x = 0?
A video game store with 25 employees sold 150 video games. The predicted amount of video games sold was 168.5. What is the residual?
Show work.
150-168.5 = -18.5
Calculate the slope using the summary statistics below for a study of Unit 3 Exam scores and time studied.
r=0.931, s_x=15 min, s_y=6.6 (exampnts)
b=0.931*6.6/15 = 0.4096
The four-letter acronym used to remember the key elements for describing a scatter plot. You MUST also list what each part of the acronym stands for.
D - Direction
U - Unusual Features
F - Form
S - Strength
A computer output shows r^2 = 0.801. The scatterplot shows a negative trend. What is the value of the correlation coefficient?
r = -0.895
Hint: square root the r^2 value. Because the direction of the scatter plot is stated to be negative, the r value should also be negative.
The equation for predicted games sold is given below. Interpret the y-intercept.
hat(gamessold) = 22+5.86(employees)
When the number of employees is 0, the predicted number of games sold is 22.
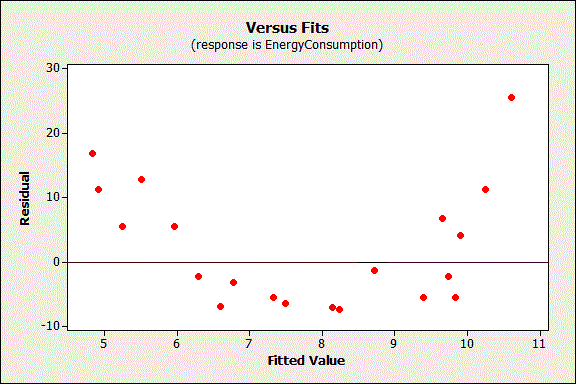
Does the residual plot shown below confirm that the linear model given is a good fit? Explain.

The linear model is not appropriate because of the clear curved pattern.
Using a regression line to make predictions for x-values far outside the original data range is called what?
Extrapolation
A study finds that children from wealthier families tend to go to school for longer. This describes what direction of association?
Positive association
Describe the relationship of this scatterplot.

The relationship between weight and cost is positive, linear, and strong with not unusual features.
The equation for games sold is given below. Interpret the slope.
hat(games sold) = 22+5.86(employees)
For each additional employee, the predicted number of games sold increases by 5.86.
A "good" residual plot that confirms the linear model given is appropriate should show what?
No pattern / random scatter.
This type of point has a much larger or smaller x-value than the other data points and has the potential to be influential.
High-leverage point
This type of graph plots the residuals on the vertical axis against the explanatory variable on the horizontal axis.
Residual Plot
For the data on college enrollment and crime, r^2 = 0.801. Interpret this value in context.
80.1% of the variation in the number of property crimes is explained by the linear relationship with student enrollment.
Using the LSRL given below, predicted the number of games sold for a store with 35 employees. Show your work.
hat(games sold) = 22+5.86(employees)
hat(games sold) = 22+5.86(35) = 227.1 games sold
The residual for the games sold at the store with 40 employees is -8.3. Interpret this residual.
The actual number of games sold is 8.3 below the predicted value for a store with 40 employees.
A study finds a positive correlation between video games sold and number of employees. What phrase would explain why we cannot conclude that more employees cause more video game sales?
Correlation does not equal causation. (a lurking variable, such as median income of the area, is likely involved).