Properties!
MM&M
Data
Graphs, tables, etc.
Thinking Critically
Vocabulary
100
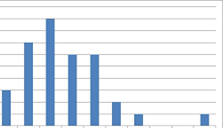
Describe this distribution in two terms:
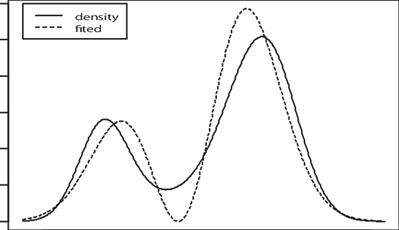
Skewed left and bimodal
100
Find the mode of the distribution
There isn't one!
100
Categorical or quantitative?
The average test score on McCool’s first stats test was an 82.
Quantitative
100
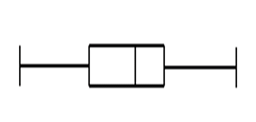
Which of these box plots has the highest IQR, and how do you know?
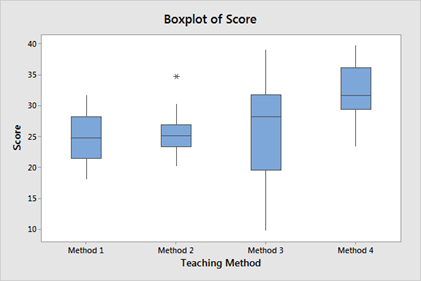
The third one, because the box is the longest
100
Describe three instances in which categorical data can hold numerical values.
Intervals, jersey numbers, credit card numbers, categories of age, etc.
100
A collection of observations or events such as test scores, ages of people in a study, or response times
Data set
200
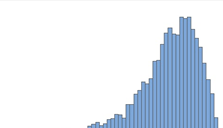
What measure of center should be used for this distribution and why?
Median because it is resistant to outliers (skews)
200
How is mean calculated?
Sum of the data divided by n
200
Categorical or quantitative?
Weight
Age
Phone number
Blood type
Q, Q, C, C
200
Name the following graphs:
Bar graph
Histogram
Stemplot
Box plot
200
Statistics is ________ and ________ data in order to better understand the world.
Collecting, analyzing
200
A characteristic to be measured or observed
Variable
300
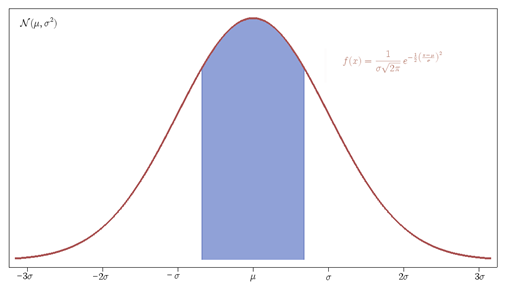
On your white board, draw a normal distribution and describe where IQR lies in the data.
300
Find the mean, median, and mode of this set of data:
4, 26, 38, 95, 114, 201, 223, 268, 300, 332
Mean: 160
Median: 157.5 or 158
Mode: None
300
Give me a real-life example, besides a yes or no question, in which you would have a two-variable distribution.
Various answers.
300
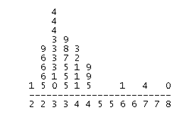
Describe the shape, best measure of center, best measure of spread, and whether there are noticeable outliers.
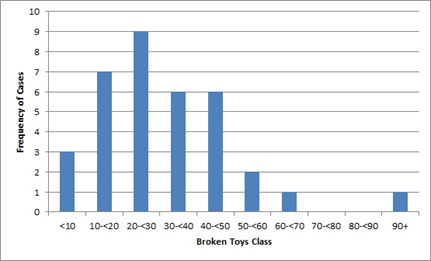
Skewed right (or symmetrical with outliers), median as the measure of center, IQR as the measure of spread, and one possible outlier at 90+.
300
What do the whiskers on a box plot stand for?
What does the stem on a stem plot stand for?
Minimum & maximum values, the first digit of every number in the set
300
If Alicia volunteers herself to participate in a study to test the physical effects of a newly developed medicine, what is she?
An individual of the study
400
What kind of graph is this?
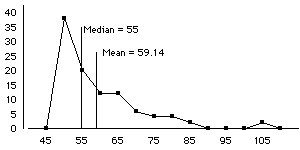
Line graph
400
True or false: the mean, median, and mode are all appropriate measures of center for a normal distribution with outliers.
False; you can only use the mean, median, and mode as the measure of center for a normal distribution with no outliers.
400
Calculate the cumulative frequency for this table and identify how many values there are total in the set:
(F)
57
21
34
45
98
112
61
32
27
(CF)
57
78
112
157
255
367
428
460
487
400
What is the formula for calculating a z-score, and what does a z-score tell us?
(X - Mean) / SD
The z-score is the amount of standard deviations a value lies from the mean
400
What concept that we recently learned about helps us estimate a percentile?
Cumulative relative frequency
400
What is this, and which formula is it found in?
The Greek symbol meaning "the sum of", and it's found in the formula for Standard Deviation
500
What measure of central tendency can be used for this distribution of data and why?
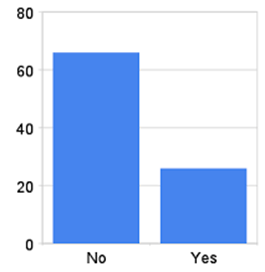
Mode, because there are only two variables
500
Find the mean, median, and mode of this set of data:
1, 13, 36, 37, 37, 38, 44, 57, 59, 80, 91, 91, 91, 97, 103, 113
Mean: 61
Median: 58
Mode: 91
500
Find the individuals, variables (labeled categorical and quantitative), and the average weight.
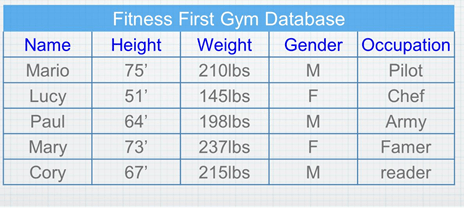
Individuals: Mario, Lucy, Paul, Mary, Cory
Variables: Height and weight (Q), gender and occupation (C)
Average weight: 201
500
Draw a box plot for this set of data:
120,125,144,147,152,179,200,213
Minimum: 120
Q1: 134.5
Median: 149.5 or 150
Q3: 190
Maximum: 213
500
What is the difference between population and sample data?
Population describes an entire group. Example: all people who live in texas, all people who live in Mansfield.
Sample is a portion of a group collected to make inferences about a population.
500
A subset of a population
Sample
600
Describe three different names for this distribution

600
Find the mean, median, and mode of this set of data:
-7, -6, -6, -5, -3, 0, 4, 8, 9, 11, 11, 11, 13, 14, 14, 18, 36, 43, 74, 91, 112, 148
Mean: 26.8 or 27
Median: 11
Mode: 11
600
Make a frequency table and a cumulative frequency table from the data:
0 0 1 1 1 2 2 2 3 3 3 3 3 4 4 5 6 7 9 9 9 9 9
0 - 2 - 2
1 - 3 - 5
2 - 3 - 8
3 - 5 - 13
4 - 2 - 15
5 - 1 - 16
6 - 1 - 17
7 - 1 - 18
9 - 5 - 23
600
Draw a CRF line chart for the data below.
Time spent on HW # of students RF
0-20 6 .375
21-40 4 .25
41-60 3 .188
61-80 2 .125
81-100 1 .063
CRF values:
.375
.625
.813
.938
1.00
600
Give me an example of an outlier in real life, and why they're important to identify.
Various answers: one specifically being the bank fraud example
600
What is this called, and what does it stand for?
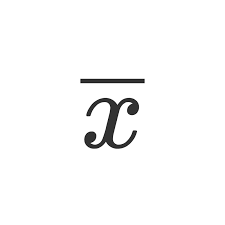
X-bar stands for the mean
700
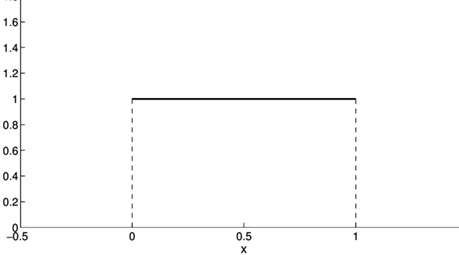
Describe this distribution two different ways and give a real-life instance in which it applies:

Symmetrical and uniform; rolling dice, flipping a coin, pulling from a deck of cards
700
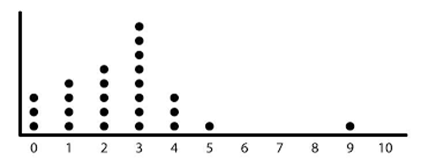
Find the mean, median, mode, range, and IQR of this data.
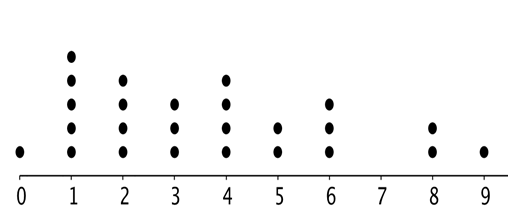
Mean: 3.64
Median: 3
Mode: 1
Range: 9
IQR: 4
700
What does n represent?
The number of values in a set of data
700
Draw the formula for standard deviation
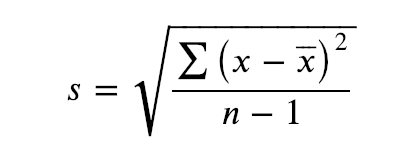
700
To find IQR, you use ________. Then, _____ it to _____ and __________ it from ____ to find the _____________. Anything outside of the _____________ is an _________.
1.5 x IQR
add
Q3
subtract
Q1
boundaries
boundaries
outlier
700
Describe standard deviation
Standard deviation is a measure of variability, or how much each value strays from the mean.