MM&M
Data
Graphs, tables, etc.
Thinking Critically
Vocabulary
100
This measure of center is found by adding up all the numbers in a data set and dividing by how many numbers there are.
What is the mean?
100
Categorical or quantitative?
The average test score on McCool’s first stats test was an 82.
Quantitative
100
This type of graph uses rectangular bars to show frequency, but unlike bar graphs, the bars touch each other.
What is a histogram?
100
Statistics is the study of this...
What is the study of data?
100
A collection of observations or events such as test scores, ages of people in a study, or response times
Data set
200
How is mean calculated?
Sum of the data divided by n
200
Categorical or quantitative?
Weight
Age
What is Quantitavie?
200
Name the following graphs:
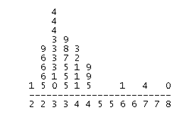
What is a Bar graph and Stemplot?
200
Statistics is ________ and ________ data in order to better understand the world.
Collecting, analyzing
200
A characteristic to be measured or observed
Variable
300
Find the mean, median, and mode of this set of data:
4, 26, 38, 95, 114, 201, 223, 268, 300, 332
Mean: 160
Median: 157.5 or 158
Mode: None
300
Give me a real-life example, besides a yes or no question, in which you would have a two-variable distribution.
Various answers.
300
Name any noticeable outliers.
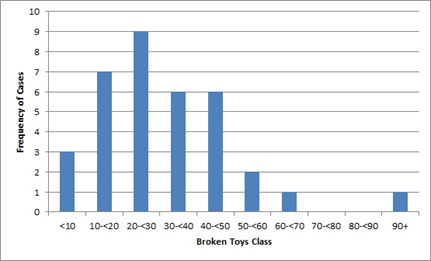
What is 90+ is the one possible outlier.
300
This is observations that have been measured, recorded, collected, analyzed, and reported for use.
What is data?
300
If Alicia volunteers herself to participate in a study to test the physical effects of a newly developed medicine, what is she?
An individual of the study
400
This measure of center is found by ordering the data from least to greatest and selecting the middle value.
What is the median?
400
The term is used when referring to data that is unorganized.
What "raw data"?
400
What type of chart is this?
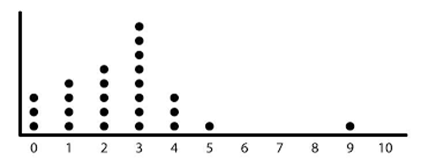
This is a Dot Plot
400
What concept that we recently learned about helps us estimate a percentile?
Cumulative relative frequency
400
What is this, and which formula is it found in?
The Greek symbol meaning "the sum of", and it's found in the formula for Standard Deviation
500
Find the mean, median, and mode of this set of data:
1, 13, 36, 37, 37, 38, 44, 57, 59, 80, 91, 91, 91, 97, 103, 113
Mean: 61
Median: 58
Mode: 91
500
Find the individuals, variables (labeled categorical and quantitative), and the average weight.
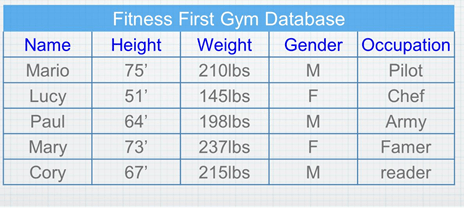
Individuals: Mario, Lucy, Paul, Mary, Cory
Variables: Height and weight (Q), gender and occupation (C)
Average weight: 201
500
In this type of table, data is organized into intervals with columns for frequency, relative frequency, or cumulative frequency.
What is a frequency distribution table?
500
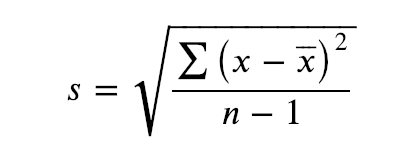
Draw the formula for standard deviation
500
A subset of a population
Sample
600
Find the mean, median, and mode of this set of data:
-7, -6, -6, -5, -3, 0, 4, 8, 9, 11, 11, 11, 13, 14, 14, 18, 36, 43, 74, 91, 112, 148
Mean: 26.8 or 27
Median: 11
Mode: 11
600
Make a frequency table and a cumulative frequency table from the data:
0 0 1 1 1 2 2 2 3 3 3 3 3 4 4 5 6 7 9 9 9 9 9
0 - 2 - 2
1 - 3 - 5
2 - 3 - 8
3 - 5 - 13
4 - 2 - 15
5 - 1 - 16
6 - 1 - 17
7 - 1 - 18
9 - 5 - 23
600
This graph shows cumulative frequencies and is useful for finding percentiles or medians.
What is an ogive?
600
Objects described by a set of data such as people, animals, or inanimate objects are referred to as this in statitistics.
What are Individuals?
600
What is this called, and what does it stand for?
X-bar stands for the mean
700
The data set is: 2, 4, 4, 5, 6, 8, 12.
This measure of center is most affected if the number 30 is added to the set.
What is the mean?
700
What does n represent?
The number of values in a set of data
700
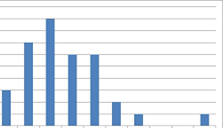
Name the following graph:
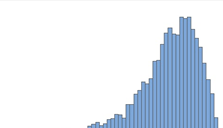
What is a histogram?
700
Information is organized using variables. Name the 2 typesof variables.
What is Categorical & Quantitative?
700
Describe standard deviation
Standard deviation is a measure of variability, or how much each value strays from the mean.