Pictographs
Bar Graphs
Pictographs
Bar Graphs
100
 What type of apple sold 14 kg?
Kiku
100
How many students scored 4 goals?
1
100
Which month got the most snow? 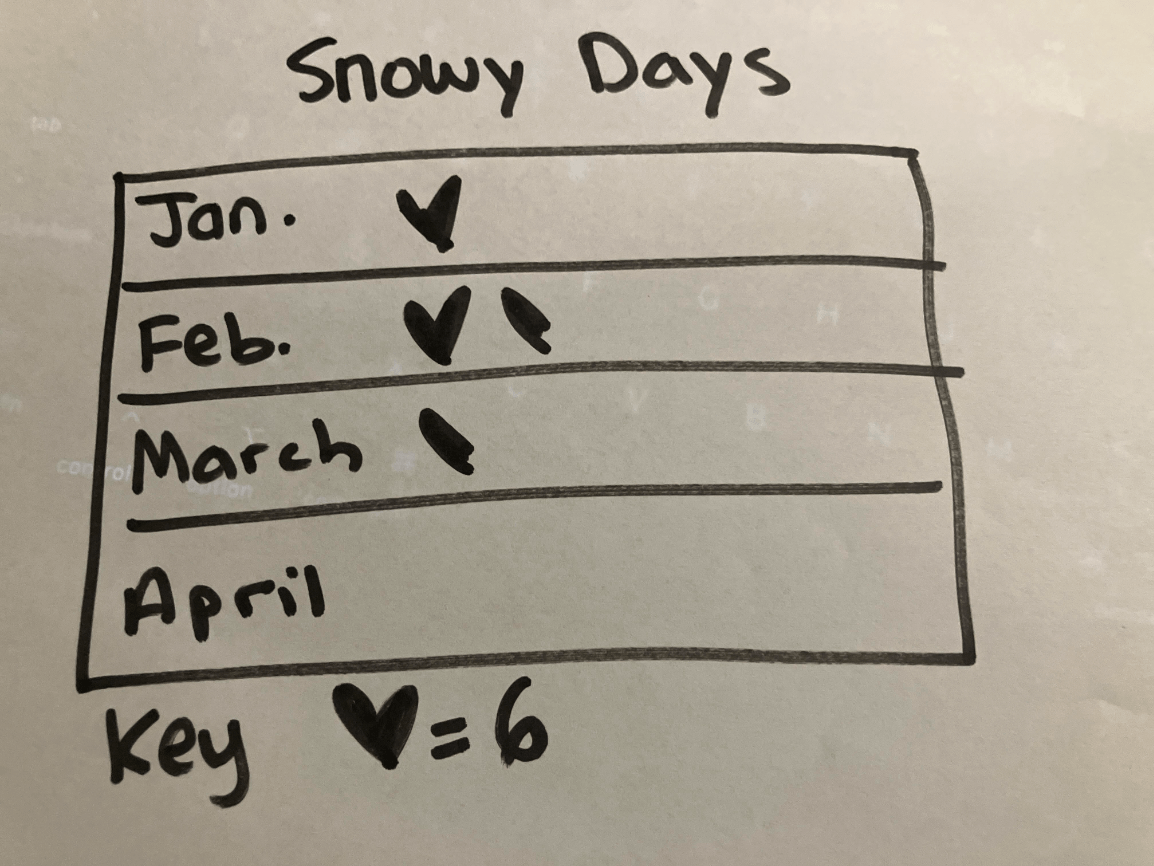
February
100
 How many students did NOT score 1 goal?
2 + 5 + 2 + 1 = 10
200
.gif)
How many people did NOT pick chocolate chip?
10 + 4 + 6 = 20
200
How many more wood frogs were seen in Week 1 than Week 2 and 3 combined? 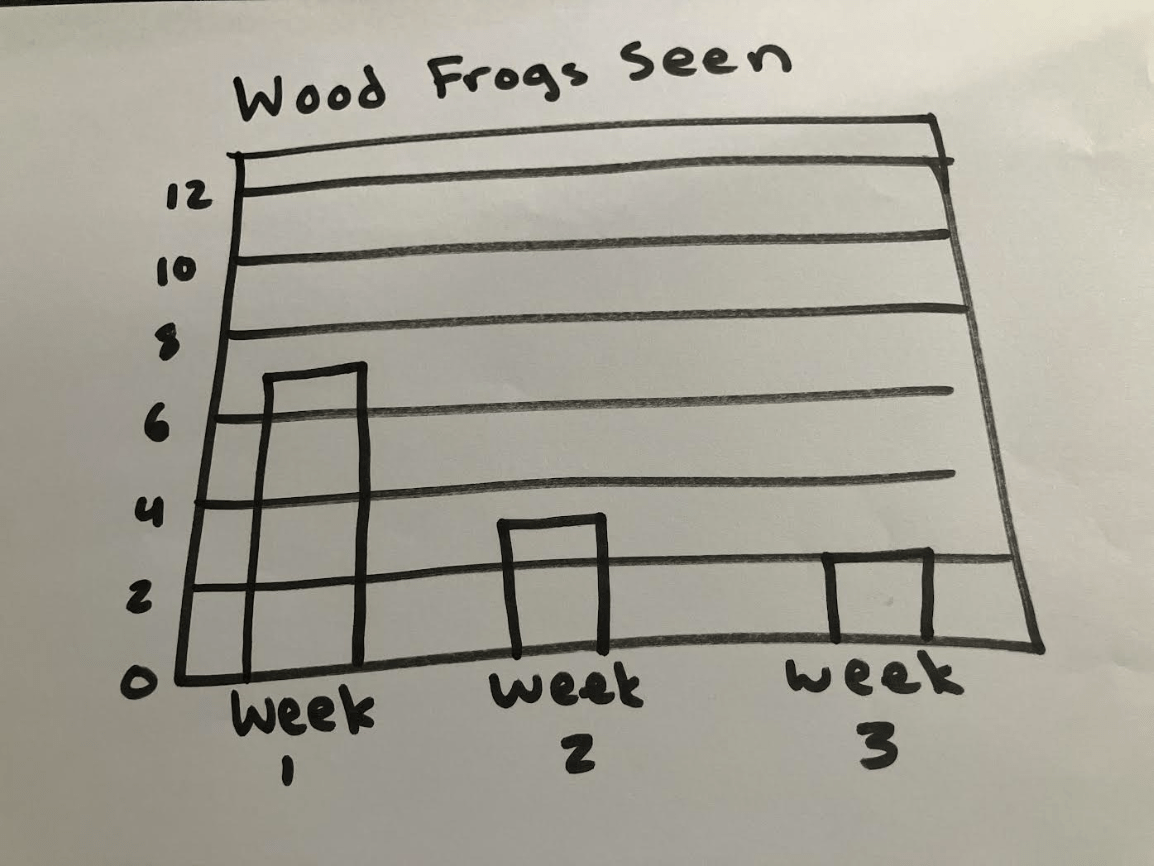
7 - (3 + 2)
7 - 5
2
200
How many days did it snow in February?

9
200
How many people liked cheese and pepperoni combined? 
16 + 10
26
300
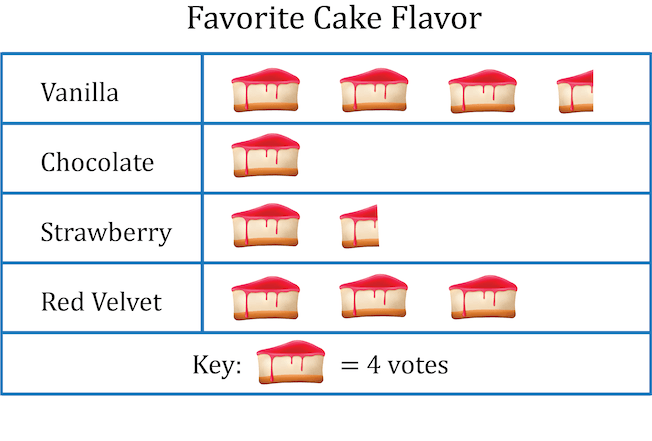 How many total people voted on their favorite cake flavor?
36
300
How many more people like cheese than veggie and pepperoni combined? 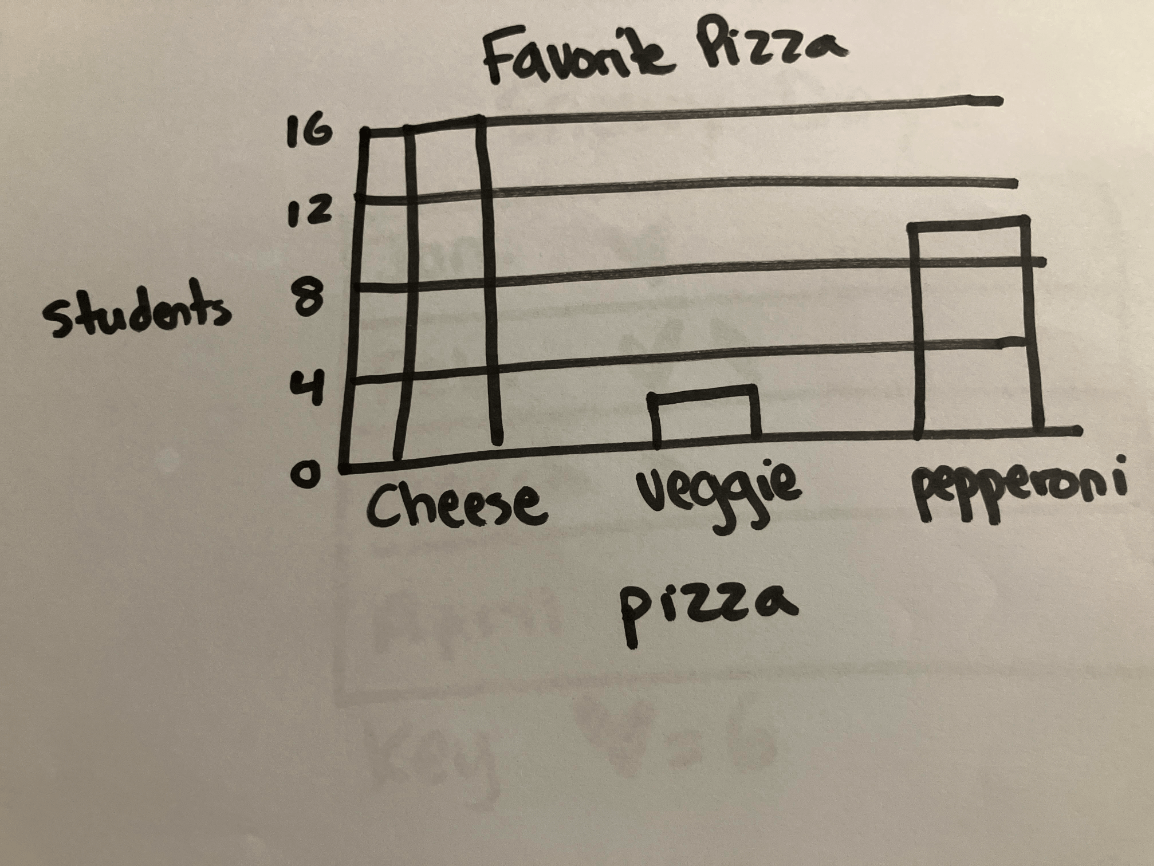
16 - (2 + 10)
16 - 12
4
300
How many more students voted for football than volleyball?

15 - 6 = 9
300
 Imagine that 11 wood frogs are seen in week 4. Where would this bar end?
a. at the 11
b. at the 4
c. between 8 and 10
d. between 10 and 12
d. between 10 and 12
400
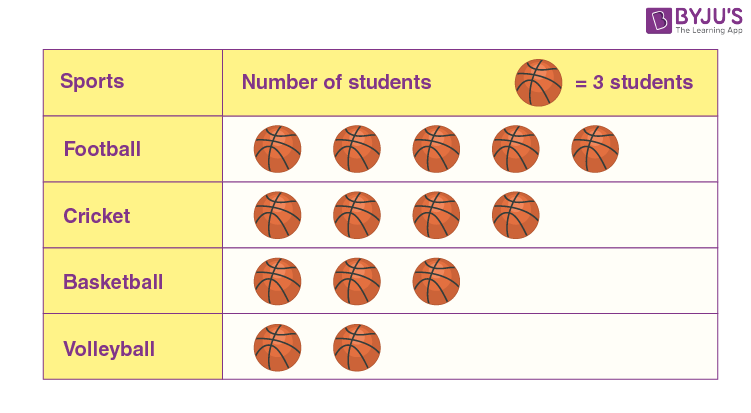
What is the difference between the sport with the most votes and the sport with the least?
Most is football with 15
Least is volleyball with 9
15 - 9 = 6
400
How many people read more than 6 books? 
4 + 10 + 7 + 4 + 2 = 27
400
How many more vehicles drove on Thursday than Friday and Sunday combined? 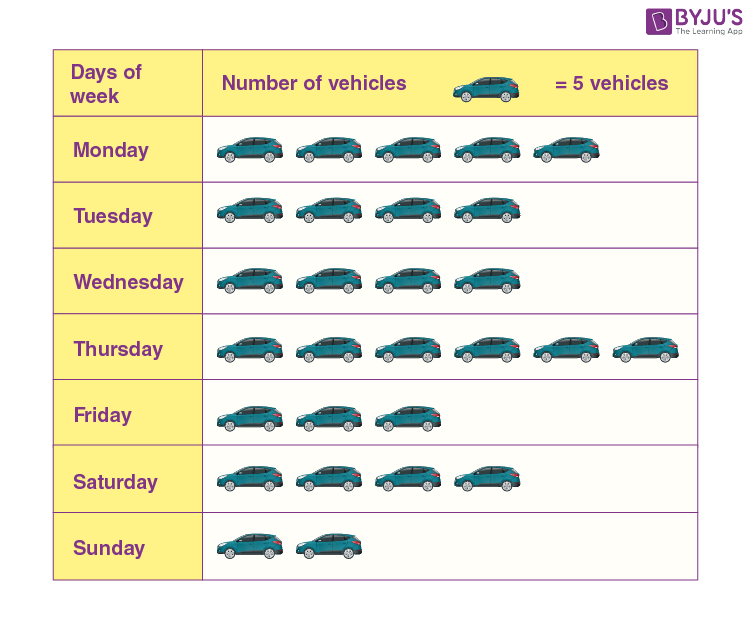
30 - (15 + 10)
30 - 25
5
400
How many students scored more than 1 goal? 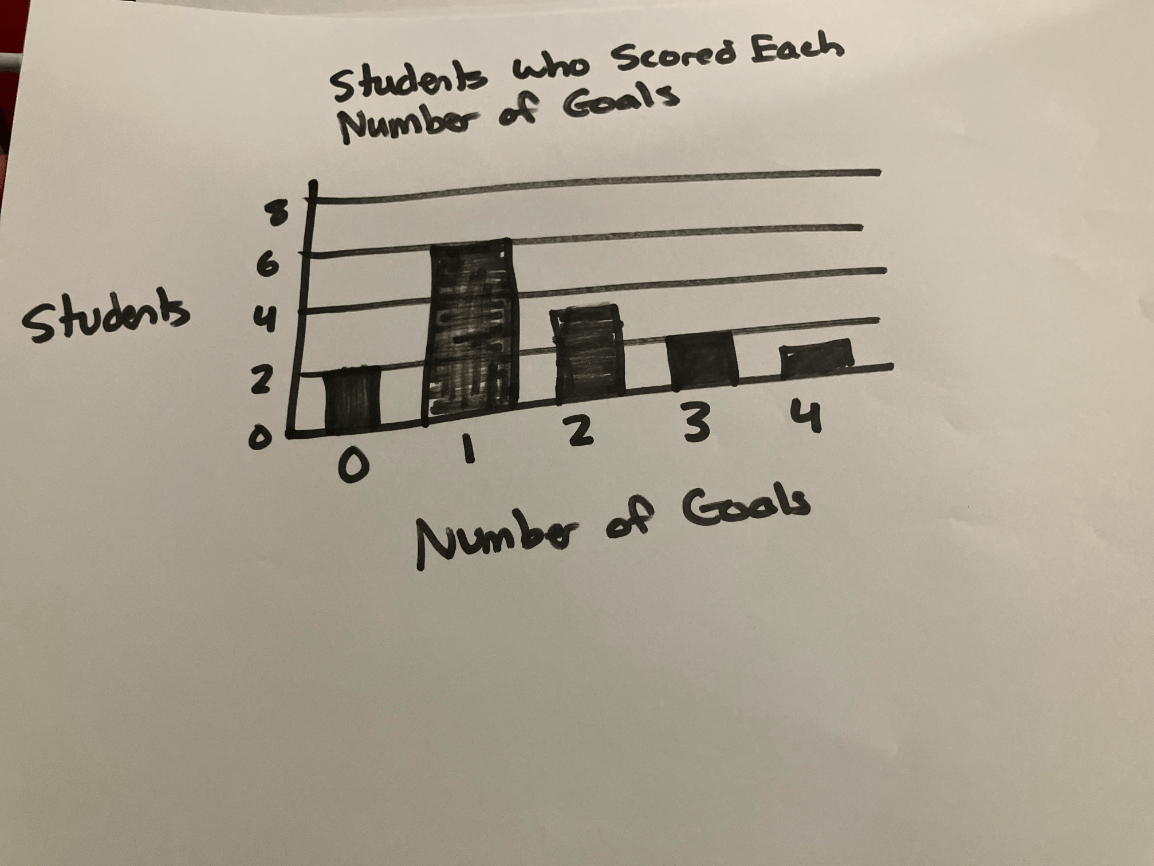
3 + 2 + 1 = 6
500
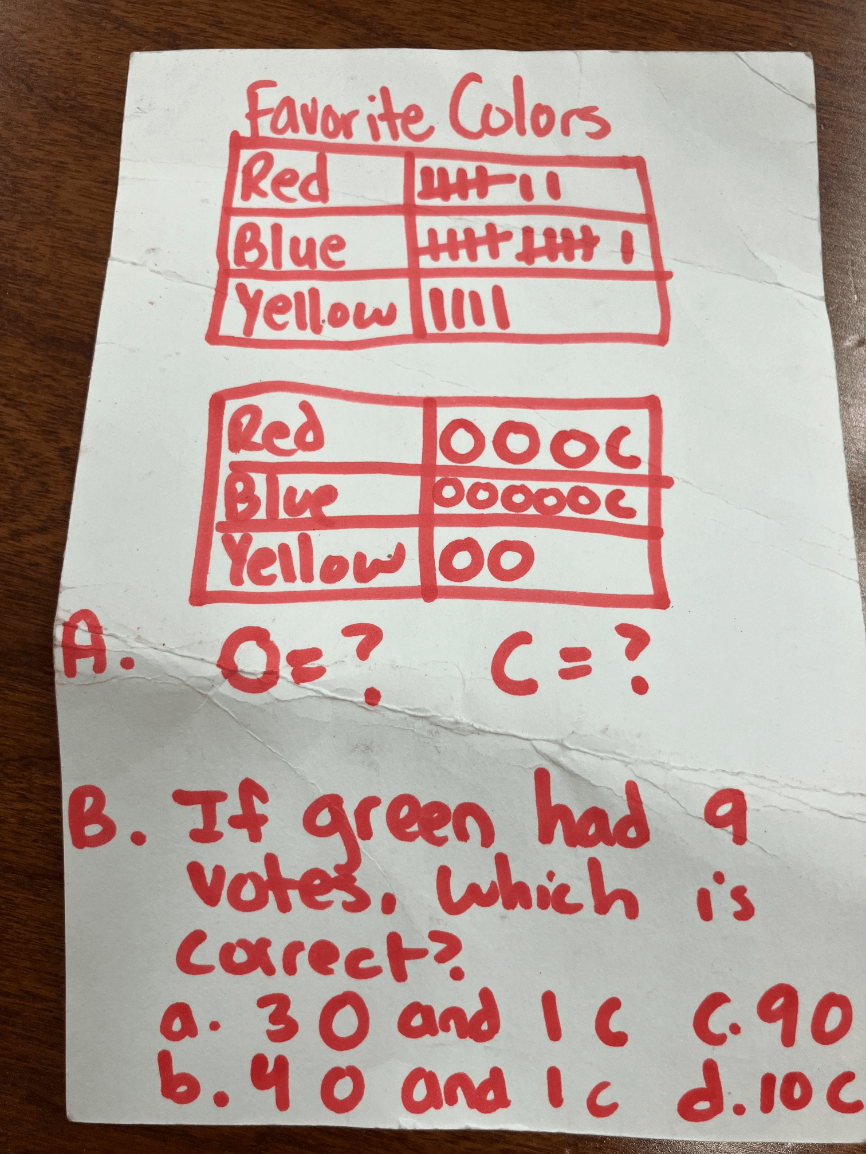
Part A:
One circle equals 2. A half circle equals 1.
Part B:
b
500
Compare students who read 8 books and students who read 5 books. How many more read 8?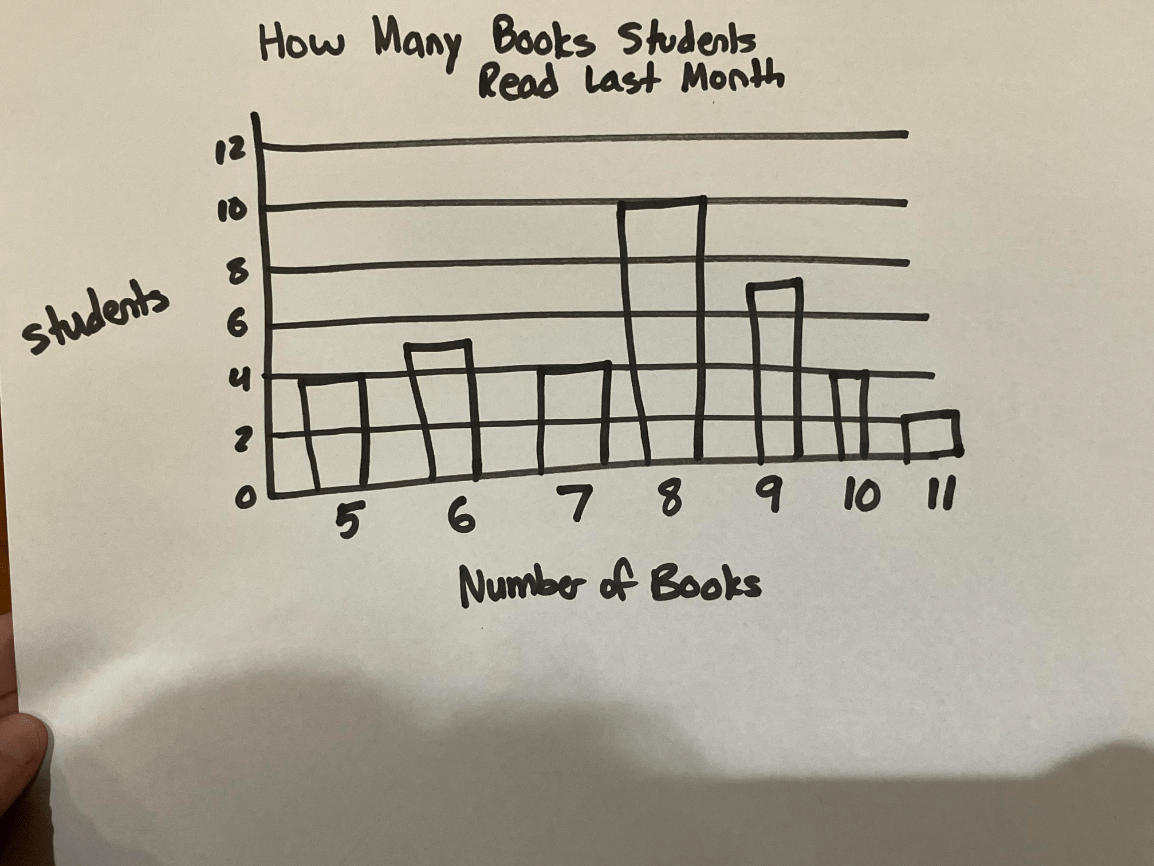
10 - 4 = 6
500
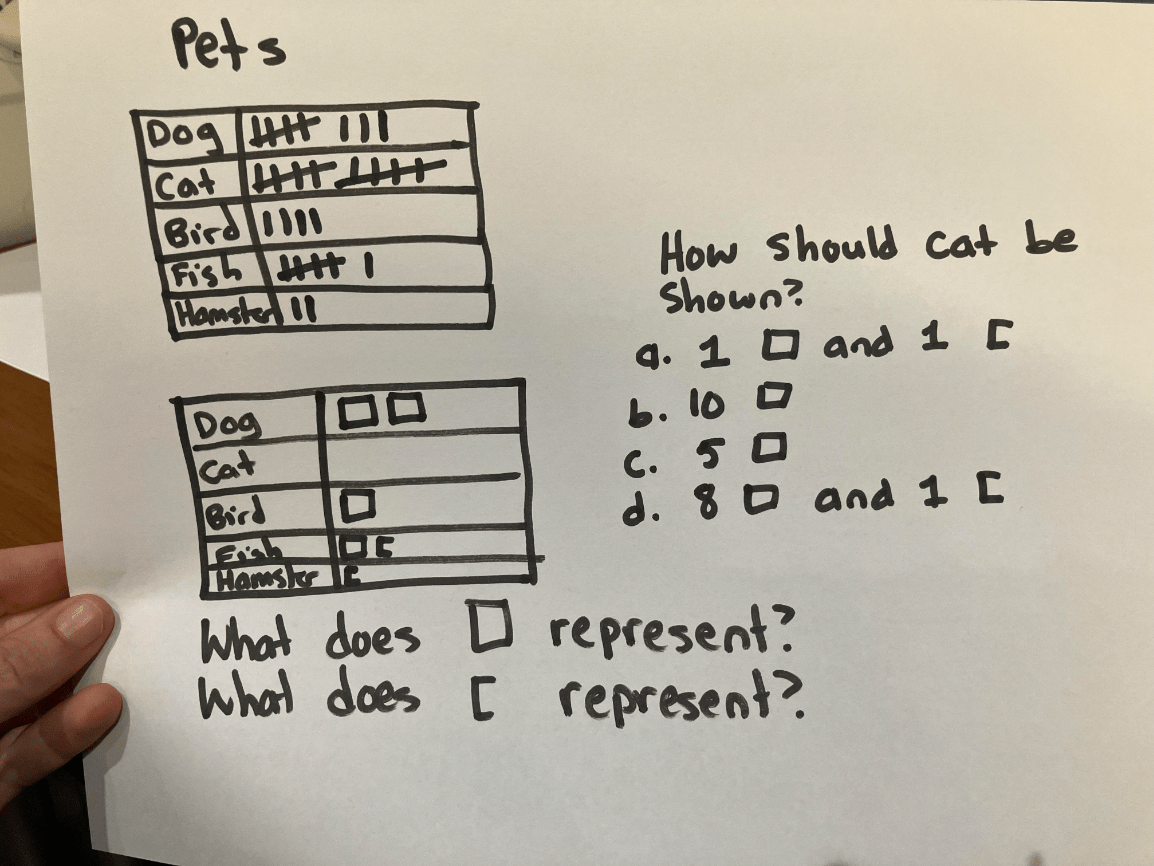
One square represents 4.
Half a square represents 2.
There are 10 votes for cat, so cat would be shown with 5 squares. This is answer c.
500
What is the difference between the number of people who read 8 books and the number who read 10 and 11 combined? 
10 - (4 + 2) = 4