Terms and Definitions
Name that Graph
Measures of Center
Sampling Methods
Measure of Dispersion
100
The science of collecting, analyzing, interpreting, presenting, and organizing data; used to understand patterns and variability, make predictions, and inform decisions.
What is statistics?
100
A graphical representation that uses rectangular bars to show comparisons among categories; bars can be oriented horizontally or vertically
What is a bar chart?
100
The arithmetic average of a data set, found by adding all the numbers in the data set and dividing by the total number of values
What is the mean?
100
The type of sampling illustrated here: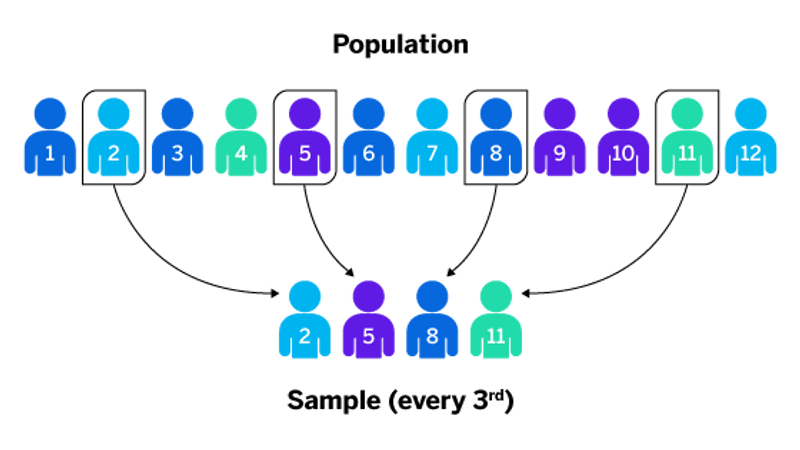
What is systematic sampling?
100
The range of this data set: 9, 3, 3, 4, 21, 8
What is 18?
200
A subset of individuals or objects from a larger population, selected to represent that population in a statistical study; used to make inferences or predictions about the entire population

What is a sample?
200
A circular graph that is divided into slices or segments to represent proportions or percentages of a whole; each slice corresponds to a part of the total, allowing for an easy visual comparison of different parts of a dataset
What is a pie chart?
200
The value that appears most frequently in a data set; a data set can have more than one if multiple values appear with the same highest frequency
What is the mode?
200
The kind of sampling method that involves choosing subjects who are most readily available
What is convenience sampling?
200
A measure of the amount of variation or dispersion in a set of values; quantifies how spread out the numbers are from the mean.
What is standard deviation?
300
Two approaches to gathering and analyzing data;one refers to information that can be measured and expressed numerically and the other refers to non-numeric information that describes characteristics or categorty
What is quantitative and qualitative data?
300
A graphical representation used to show the distribution of a dataset; similar to a bar chart but used for showing the frequency of data in intervals or bins and there is no space between the bars
What is a histogram?
300
The measure of center least affected by outliers, as it represents the middle value of a sorted data set and is not influenced by extreme values.
What is the median?
300
A benefit of using a sample to study a population
What is a sample is usually quicker and less expensive than studying the entire population ?
300
The variance of a data set who standard deviation is 3.
What is 9?
400
A method of selecting a subset of individuals from a population in such a way that every possible sample of the desired size has the same chance of being chosen; helps to ensure that the sample is representative of the population
What is simple random sampling?
400
A graph used to represent the relationship between two numerical variables; uses dots to represent the values of two different variables, one plotted on the x-axis and the other on the y-axis; often used to identify correlations between variables
What is a scatterplot?
400
An average where some values contribute more to the final mean than others; used when different values have different levels of importance or relevance (e.g. your course averages)
What is a weighted average?
400
The most appropriate sampling method for analyzing a large population distributed across different cities
What is cluster sampling?
400
The rule illustrated here:
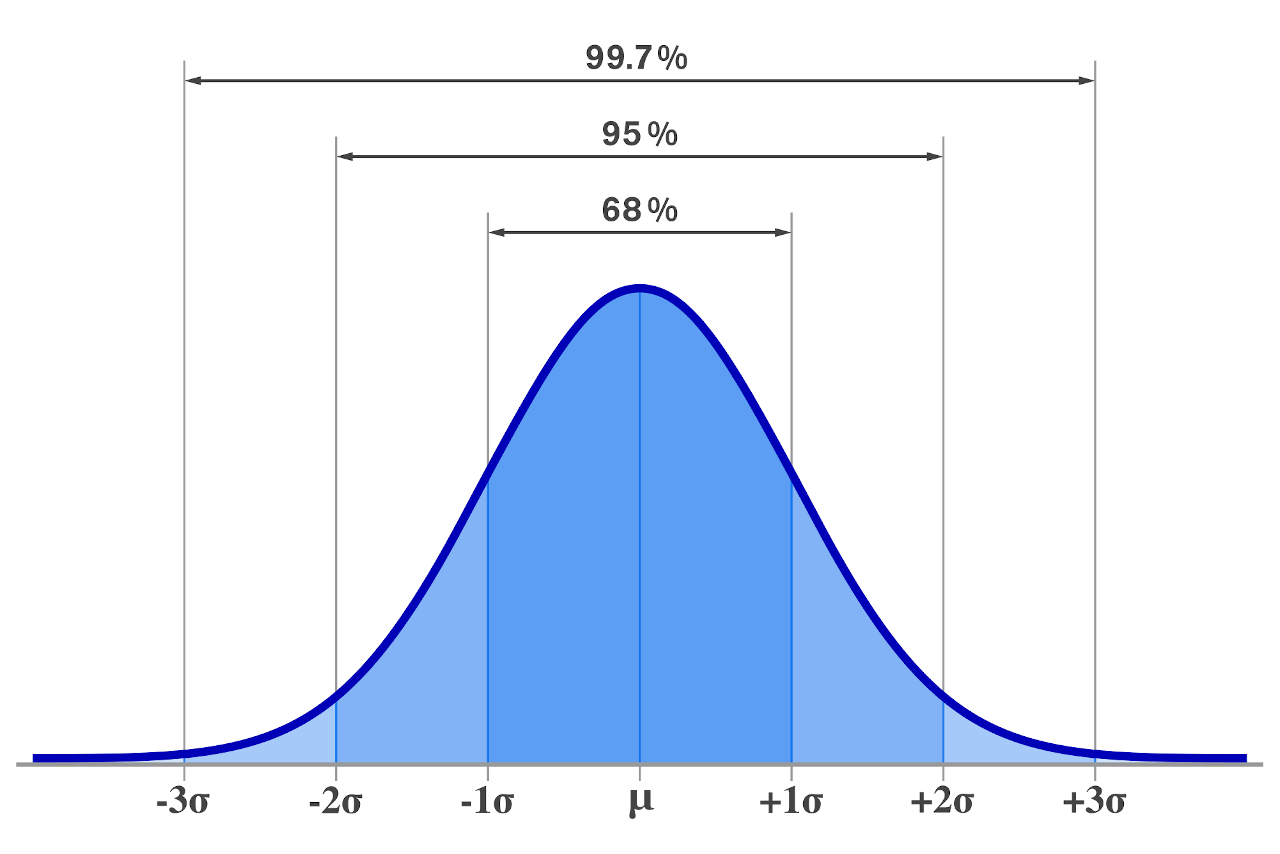
What is the empirical rule?
500
Refers to a systematic error that occurs when the sample data is not representative of the population being studied; can lead to incorrect conclusions and misinterpretations
What is bias?
500
The kind of graph displayed here:
What is a boxplot or box-and-whisker plot?
500
The median is this data set: 2, 4, 6, 6
What is 5?
500
What you must do with each subgroup when using stratified sample
What is randomly select individuals from each subgroup to include in the sample?
500
Graph with greater dispersion of data

What is Graph B?