3-1
3-2
3-3
3-4
3-5 & 3-6
100
Fill in the blank.
A relation is a ____ if which each input, or x-value, has exactly one output, or y-value.
Function
100
What is the test called to determine if a graph is a function or not?
The vertical line test
100
What is a function whose graph is a straight line and has a constant rate of change?
A linear function
100
What equation represents a linear relationship between two quantities, x and y?
y = mx + b
100
Fill in the blank.
A ____ is a period of time between two points of time or events.
Interval
200
Does the table below represent a function?
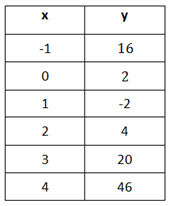
The table does represent a function
200
What are different representations of a function? Name all.
An equation, a table, and a graph
200
What is a function, which is not a straight line and does not have a constant rate of change?
A nonlinear function
200
How can you write the equation for a linear function if you know only two ordered pairs for the function?
Fill in the blanks. Tiles may be used once, more than once, or not at all.
Word bank: m, two ordered pairs, one set of ordered pairs, b
Use the two ordered pairs to find the slope, _____.
Then substitute ______ and _____ into y = mx + b to solve for _____.
1st blank- m
2nd blank- one set of ordered pairs
3rd blank- m
4th blank- b
200
Ivan's mother brings him a bowl of carrots as a snack. At first he does not eat any; then he eats one at a time until half of the carrots are gone. Then he does not eat any more.
Draw a graph that shows the number of carrots in the bowl over time.
On Google Slides.
300
Does the following relation represent a function?
{(−5,8), (−6,5), (−8,2), (−7,1), (−9,9), (−1,7)}
The relation does represent a function
300
Does this image show a function?
The image does show a function
300
Which linear function has the greater rate of change?
A. y = 3x + 1
B. {(1,3), (2,7), (3,11), (4,15)}
B
300
What is the equation of a line that passes through (0.5, 4.25) and (2, 18.5)? Use the form y = mx + b.
y = 9.5x - 0.5
300
What do each of the different intervals represent? Is the line increasing, decreasing, or constant?
Line 1- decreasing
Line 2- decreasing
Line 3- increasing
Line 4- constant
400
Does the arrow diagram represent a function?

The arrow diagram does represent a function
400
1. Is the graph linear or nonlinear?
2. Does the graph represent a function or not a function?
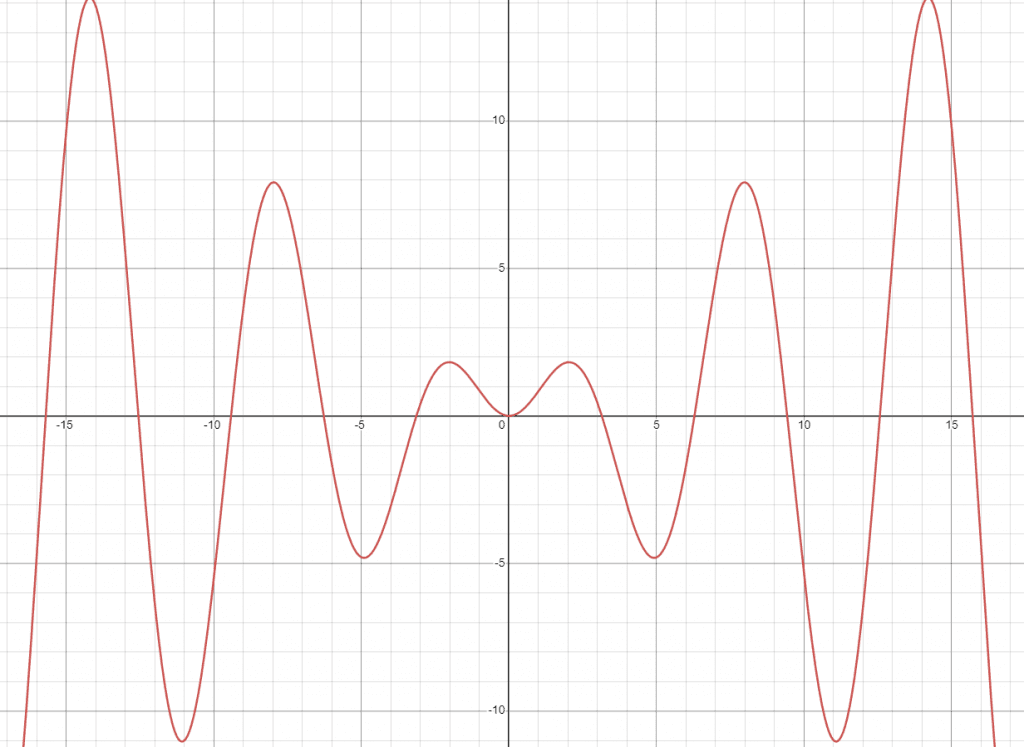
1. The graph is nonlinear
2. The graph represents a function
400
Two athletes are training over a two-week period to increase the number of pushups each can do consecutively. Athlete A can do 15 pushups to start, and increases his total by 2 each day. Athlete B is charting his progress in the table. Compare the initial values for each.
Choose the correct answer below.
A. The initial value for Athlete A is greater.
B. The initial values are equal.
C. The initial value for Athlete B is greater.
A
400
Max puts a stopper in the bathtub and turns on the faucet at t = 0.
After 5 minutes, there are 11 gallons of water in the tub and after 10 minutes, there are 22 gallons in the tub.
Write an equation that relates the number of gallons, g, to the time, t.
Does the relationship represent a linear function? Pick one of the choices below.
A. g = 2.2t; The equation represents a linear function because the equation is in the form y = mx.
B. g = 4.4t; The equation represents a linear function because the equation is in the form y = mx.
C. g = 2.2t; The equation does not represent a linear function because the equation is not in the form y = mx + b.
D. g = 4.4t; The equation does not represent a linear function because the equation is not in the form y = mx + b
A
400
Which term best describes the graph of y = x – 1?
A. Positive
B. Increasing
C. Constant
D. Decreasing
B
500
Does the following relation represent a function?
{(2,4), (5,10), (4,8), (-2,6), (-9,9), (2,8)}
The relation does not represent a function
500
You have an ant farm with 36 ants. The population of ants in your farm will double every 3 months. The ordered pairs show the population growth of the ants over nine months.
{(0,36), (3,72), (6,144), (9,288)}
1. Does the ordered pairs represent a linear function or a nonlinear function?
2. After one year, how many ants will there be in the ant farm?
1. The ordered pairs represent a nonlinear function
2. After one year there will be 576 ants in the ant farm
500
A linear function models the height of a burning candle. Candle A comes out of the mold at 225 mm, and is expected to be at 201 mm after 8 hours of burning. The model for Candle B is h=190−8t, where h is the height in millimeters and t is the time in hours.
1. What are the initial values for each candle?
2. When the candles begin to burn, which candle is taller?
1. The initial value for Candle A is 225 mm and the initial value for Candle B is 190 mm
2. Candle A is taller when they begin to burn
500
A line passes through the points (5, –7.5) and has a y-intercept 10.
Which line has a rate of change that is less than this line's rate of change?
A. y= –1.5x + 10
B. y = 0.5x + 10
C. y = –10x – 3.5
D. y = –3.5x + 10
The correct answer is C
500
Which term best describes the graph of y = –2?
A. Decreasing
B. Positive
C. Increasing
D. Constant
D