Scientific Method
Variables
Data
Graphs
Random
Random 2
100
1st step of scientific method
Question
100
Name 2 types of variables
Independent
Dependent
Constant
100
The length (meters) of a school bus is (qualitative or quantitative) data.
Quantitative
100
Graph type: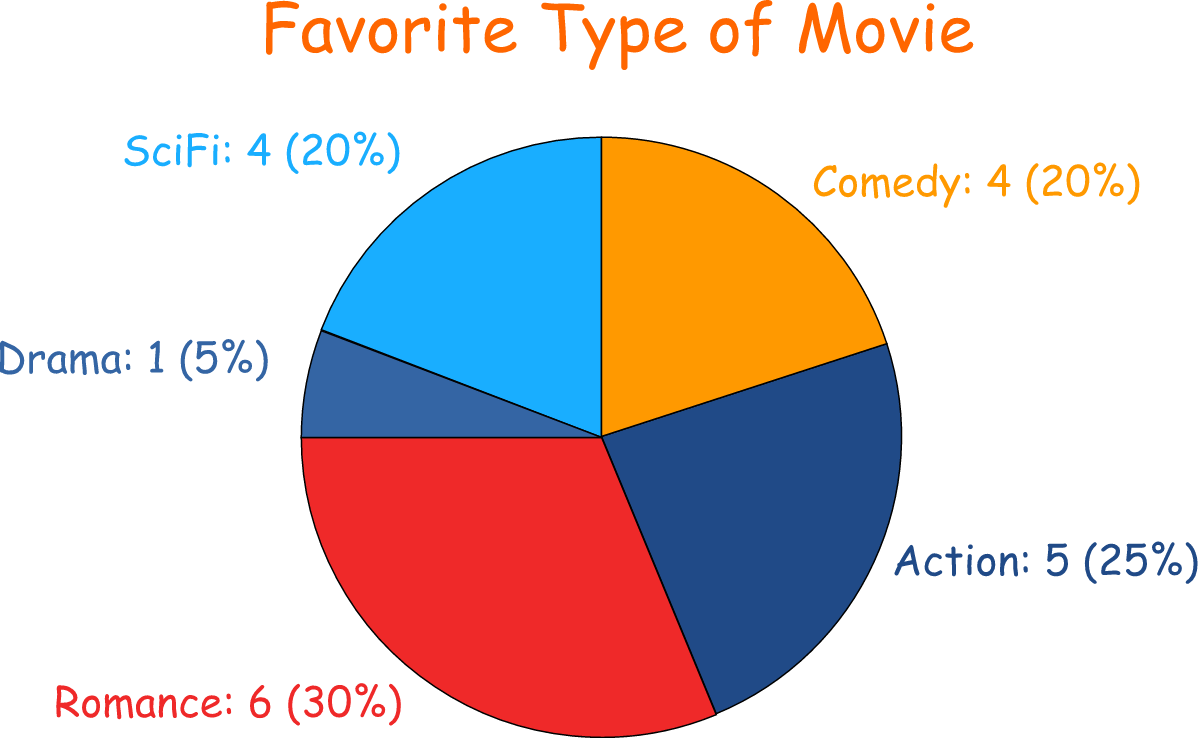
Pie
100
Last step of scientific method
Results
100
Type of graph:

Bar
200
Word for a testable statement that answers a scientific question
Hypothesis
200
The name of a variable that stays the same throughout the entire experiment
Constant
200
Data involving words, like "the sun is bright" is ___________
Qualitative
200
The x-axis has this variable

Year
200
The part or group of the experiment WITHOUT the independent variable (the "baseline" or "normal")
Control group
200
Name of the vertical axis
y-axis
300
Why the scientific method is important
Provides guideline for all scientists to follow
Makes sure experiment can be replicated
*Either answer acceptable
300
The INDEPENDENT variable of:
If I give plants salty water, then the plants will die because plants do not grow with too much salt.
Salty water
300
What type(s) of data is/are shown in the table?
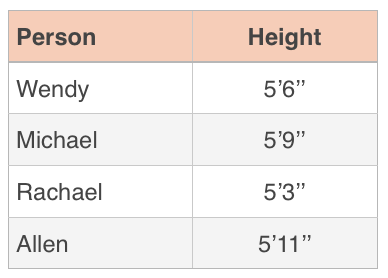
Qualitative AND quantitative
300
The graph is missing
Axis labels with units
*A better title = 150 points
300
The INDEPENDENT variable of:
How does sunlight affect the number of bees on flowers?
Sunlight
300
The DEPENDENT variable of:
If I give freshwater fish salty water, then the fish will not survive because freshwater fish cannot live in salty water.
Fish survival
400
5 steps of the scientific method, in order
Question
Research
Hypothesis
Experiment
Results
400
Identify the independent AND dependent variables:
"How does weather (sunny vs. cloudy) affect the number of bees?"
IV = weather (sunny vs. cloud)
DV = # of bees
400
Two examples of QUALITATIVE data
Two examples of QUANTITATIVE data
QUALITATIVE = words
QUANTITATIVE = numbers
400
The year with the highest average temperature in July
2000
400
The control group for:
"Sarah tested how water (more or less) affects plant growth (m, meters). She has 3 pots. Pot 1 is given the normal amount of water. Pot 2 is given less water. Pot 3 is given more water."
Pot 1
400
You conduct a study and your hypothesis is wrong... now what?
Share results AND/OR revisit hypothesis and redo experiment
500
A hypothesis for the question:
"How does the amount of light (less, more) affect the brightness of flowers?"
*IF...THEN...BECAUSE...
IF I add more light THEN the flowers will be brighter BECAUSE light helps flowers produce color.
500
Name 2 constant variables for:
"Sarah tested how water (more or less) affects plant growth (m, meters). She has 3 pots. Pot 1 is given the normal amount of water. Pot 2 is given less water. Pot 3 is given more water."
- Size of pot
- Type of plant
- Location of pots
- Amount of light each pot gets
* Anything EXCEPT how much water or plant growth*
500
Why might it be important to use both qualitative and quantitative data in a single study?
They offer different perspectives of the data
500
A claim that summarizes the graph:
Temperature increases in a day
Temperature is highest in the afternoon
500
Why constant variables are important
To truly test the relationship between independent and dependent variables (without influence of other variables)
500
The year with the lowest population
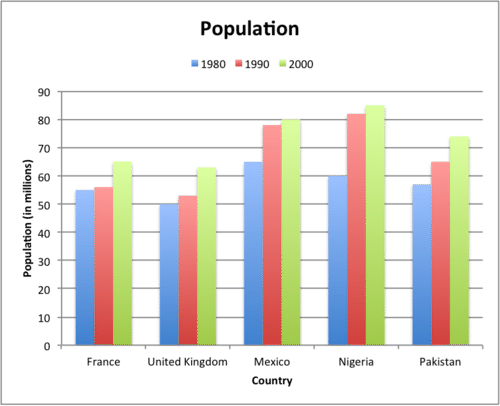
1980