Correlations
Explanatory and response variables
Interpreting x and y intercepts
Residuals and other measures
100
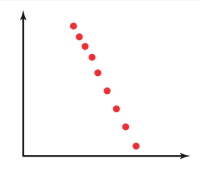
Describe the correlation in terms of direction and strength
Perfect negative linear correlation
100
Determine the explanatory variable from the statement
The age of a motor car and the asking price for the car
Age of a motor car
100
The average rate of change in the response variable for each increase of one unit of the explanatory variable
Gradient
100
___________=predicted value - actual value
Residual
200
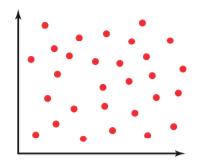
Describe the correlation in terms of direction and strength
Zero correlation
200
Determine the explanatory variable for the following statement
Performance in a team game and lack of sleep
Lack of sleep
200
The value of the response variable when the explanatory is zero
y intercept
200
If a pattern is present in a residual graph we say this
Linear model is not suitable
300
Describe the correlation in terms of direction and strength
r= -0.7
Moderate negative correlation
300
Which determines whether we use row or column percentages, the explanatory or response variable?
Explanatory variable
300
Interpret the gradient of the following
predicted shoe size= 0.25 x height -33.4
(height is in cm)
For every increase in 1cm of height, there is an increase of 0.25cm in shoe size.
300
The values on the x-axis on a residual graph
Explanatory values
400
Describe the correlation in terms of direction and strength
r=0.10
Weak positive correlation
400
A graph used to display percentage proportions
Stacked column graph
400
Interpret the y intercept for the following
response time = -8.54 x drug dose +45.55
(time is in seconds)
When there is no drug dose administered, response time is 45.55 seconds
400
The percentage variation in the response variable that can be attributed to the explanatory variable
Coefficient of determination
500
To find the correlation coefficient from the coefficient of determination we do this
Find the square root of the coefficient of determination
500
If there is variation in the percentage proportions of greater than 5% there is ______________ present
Association
500
Interpret the slope and y intercept for the following
Son's height (cm)= 0.54x Father's height (cm) +89.58
For every 1cm increase in father's height, there is a 0.54 increase in son's height. When father's height is zero, son's height is 89.58cm
500
interpret a coefficient of determination of 0.89
89% of the change in the response variable can be attributed to the change in the explanatory variable