Definitions
True or False?
Box Plots
MMMR and IQR
100
The average of the numbers in a data set
Mean
100
Given the data set:
10, 11, 15, 16, 16, 20, 25
The range is 10.
False. The range is 25 - 10 = 15.
100
What is the median?
15
100
In the data set below, what is the mode?
54, 54, 54, 55, 55, 58, 58, 59, 59, 59, 59
59
200
The middle number
Median
200
Given the data set:
3, 3, 4, 4, 5, 5, 5, 5, 10, 11, 11, 11, 11, 12
The mode is 5 and 11.
True.
200
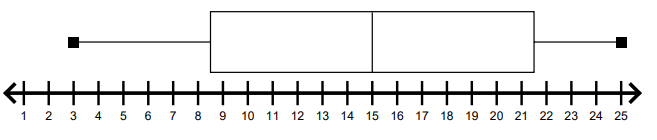
What is the Minimum and Maximum value?
Minimum - 4
Maximum - 25
200
In the data set below, which of the following is the range?
5, 5, 6, 7, 7, 8, 10, 11, 20, 25, 26, 26
26 - 5 = 21
300
When you split the data in half and find the median of the lower half of the data set.
Lower Quartile or Q1
300
Given the data set:
4, 40, 45, 46, 47, 50, 59
The mean is 46?
False. The mean is about 42.
300
Find the Interquartile Range
13
300
Which of the following choices is closest to the mean?
2, 7, 9, 13, 13, 14
a) 9.0 b) 8.6 c) 8.5 d) 9.7
d) 9.7
400
The upper quartile (Q3) minus the lower quartile (Q1) is called...
Interquartile Range
400
Given the data set:
2, 8, 10, 10, 10, 12
Mode = Median
True. The mode is 10 and the median is 10.
400
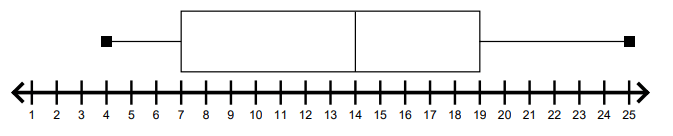
Describe the spread, or range, of data.
From 6 to 20
400
The data listed below represents the weather from the last 12 days:
45, 50, 64, 65, 65, 67, 70, 70, 71, 75, 78, 84
What is the mean, median, mode, and range of the data?
Mean = 67
Median = 68.5
Mode = 65, 70
Range = 39
500
The spread of the data set.
Range
500
Given the data set:
2, 4, 5, 5, 5, 6, 7, 9, 9, 10, 11, 14
The interquartile range is 5.
False. Find the Q1 and the Q3.
Q3 - Q1
9.5 - 5 = 4.5
500
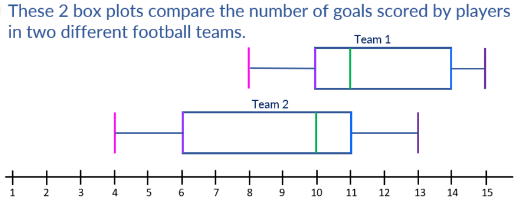
Which statement correctly describes the relationship between the football teams.
A) The median goals for team 1 is less than the median goals for team 2.
B) The range of goals for team 1 is less than the range of goals for team 2.
C) The interquartile range of team 1 is greater than the interquartile range for team 2.
B
500
What is the interquartile range of the data set below?
38, 42, 46, 52, 54, 57, 60
Q3 - Q1
57 - 42 = 15