Define me
What is this number?
Box Plots
Review
100
What is the median?
The middle number in a set of data
100
In the set of data,
11, 14, 16, 18, 20, 23, 26. What is the number 14?
The lower quartile (Q1) = 25th percentile
100
What is the interquartile range in this box and whisker plot?
70-30= 40
100
What is the average of this data set? ROUND TO THE NEAREST HUNDRETH
14, 87, 27, 48, 12, 23
35.17
200
What is the five number summary?
The maximum, minimum, lower quartile, upper quartile and median
200
What is the number 50.5 in the data set 34, 56, 45, 24, 12, 33
the upper quartile
200
What is the 25th percentile in this box and whisker plot?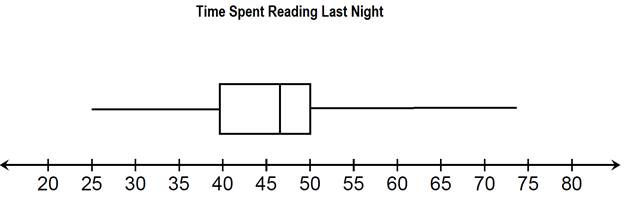
40
200
What is the standard deviation of this data set? ROUND TO THE NEAREST HUNDREDTH
12, 15, 13
1.25
300
What is the interquartile range?
The difference between the upper quartile and lower quartile
300
What is the number 106.5 in the data set
143, 101, 180, 156, 112, 123
the lower quartile
300
What is the range of scores that encompasses 50% of the quiz results?
70-30= 40%
300
You survey several students to determine the average number of books read per month. Determine the average number of books read per month by your classmates. ROUND TO THE NEAREST TENTH
((0*3) +(0*1) +(2*7)+(3*6)+(4*6)+(5*3)+(6*4)+(7*8)+(8*2)+(9*8))/50=4.8
400
What is the lower quartile?
The median of the lower half of the set of data
400
In this set of data, what is the number 45?
13, 15, 19, 32, 79, 23, 60
The interquartile range
400
Draw a box plot representing the data
25, 40, 45, 47, 48, 50, 75
400
Tuna decides to play basketball, so you record the number of points he gets during the game. He makes 2 shots from behind the 3point line (worth 3pts), 4 shots inside the 3point line (worth 2 pts) and 2 free throws (worth one pt). What is the average number of points per throw he got?
2 points average per throw
500
Where is 50% of the population located on the box and whisker plot?
Within the box; between the lower and upper quartiles
500
What is the number 52 in the data set 63, 14, 23, 78, 28, 58
The interquartile range
500
Draw a box and whisker plot using the following data set:
85, 78, 98, 69, 94, 90, 80

500
Tuna wanted to figure out the standard deviation of the number of treats he gets a day. He counted getting 1 treat on 2 days, 2 treats on 1 day, 3 treats on 3 days and 4 treats on 1 day. What is the standard deviation of this data?
Average: 2.43
Standard Deviation: 1.1
Average= (1*2)+(2*1)+(3*3)+(4*1) divided by 7 days = 17/7=2.432.04*2+0.32*3+0.18*1+2.46*1
4.08+0.96+0.18+2.46=7.68/7=1.1