Define me
What is this number?
Box Plots
Mixed Review
Stem and Leaf Plots
100
What is the median?
The middle number in a set of data
100
In the set of data, 


11, 14, 16, 18, 20, 23, 26. What is the number 14?

The lower quartile (Q1) 
100
What is the interquartile range in this box and whisker plot?
70-30= 40
100
What is the mean of this data set? ROUND TO THE NEAREST HUNDREDTH


14, 87, 27, 48, 12, 23

35.17
100

Find the range:


30

200
What is the five number summary? List all 5.
The maximum, minimum, lower quartile, upper quartile and median
200
What is the number 50.5 in the data set 34, 56, 45, 24, 12, 33


the upper quartile (Q3)
200
What is the lower quartile (Q3) in this box and whisker plot?
40
200
What is the standard deviation of this data set? ROUND TO THE NEAREST HUNDREDTH


12, 15, 13

1.25
200

Find the mean:


60.67

300
What is the interquartile range?
The difference between the upper quartile and lower quartile
300
What is the number 106.5 in the data set

143, 101, 180, 156, 112, 123

the lower quartile

300
What percent of student scored below 70?
75%
300

You survey several students to determine the average number of books read per month. What is the mode? 


7 and 9
300

Find the mode:


34

400
What is the lower quartile?
The median of the lower half of the set of data
400

In this set of data, what is the number 45?

13, 15, 19, 32, 79, 23, 60

The interquartile range (IQR)
400
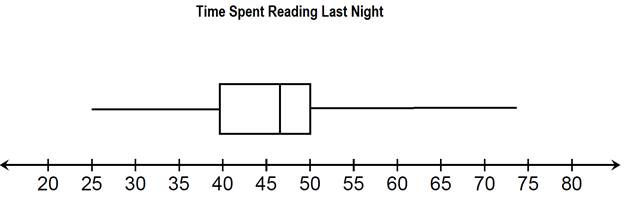
Draw a box plot representing the data


25, 40, 45, 47, 48, 50, 75

400

The principal of the school is looking over grade reports, specifically scores on math quizzes. This box-and-whisker plot shows the results.

Find median, IQR, and range in the given box plot:


Median: 75

Range: 45

IQR: 20


400

Find the median:


median-23

500
Where is the middle 50% of the population located on the box and whisker plot?
Within the box; between the lower and upper quartiles
500

What is the number 52 in the data set 63, 14, 23, 78, 28, 58


The interquartile range (IQR)
500
Draw a box and whisker plot using the following data set:


85, 78, 98, 69, 94, 90, 80

500

Which one of the following box plots have 72 as a lower quartile?

A

B

C


D


500

Mr. Murphy asked 24 of his students how many miles they live from the school.  The stem and leaf plot shows the data.


Which of the following is a true conclusion based on the data in the stem and leaf plot?

A)Five students live 1 mile from the school.
B)Three students live 4 miles from the school.
C) Exactly half the students live 7 or more miles from the school.  
D) The maximum distance a student lives from the school is 15 miles.


A)Five students live 1 mile from the school.
M
e
n
u