Outliers
5 number Summary
Mean Median Mode and Range
Box-and-Whisker Plot
Miscellaneous
100
What is the IQR of the data set 107, 114, 124, 108, 117, 106, 107, 109, 117, 115
What is 10
100
What is Q3 - Q1
What is the Interquartile range?
100
What is the mode of the data set 42, 36, 58, 47, 34, 43, 36, 54, 49, 48, 41, 38, 36, 58, 72, 39
What is 36?
100
What must your number line do for you to get full points on the test?
What is a constant increase?
100
Explain how to determine from a box-and-whisker plot whether there are any outliers in the data.
What is the outliers are shown as a dot beyond the maximum and minimum values, disconnected from the whisker of the box?
200
What is the formula to find Upper and Lower fences?
What is:
Q1 - 1.5 x IQR
Q3 + 1.5 x IQR
200
What is the Q1 of the data set 14, 18, 16, 24, 19, 15, 13
What is 14
200
What is the range of the data set 14, 16, 18, 24, 19, 15, 13
What is 11
200
What is drawn around the IQR.
What is the box?
200
Explain what the upper quartile (3rd Quartile) is.
What is the median of the upper half of a set of data?
300
What is The lower fence in the data set 132, 116, 108, 113, 126, 120, 131, 112, 126
What is 88.5
300
What is Q3 in the data set 90, 88, 72, 85, 92, 95, 93, 86, 92, 91
What is 92?
300
What is the median of the data set 29, 27, 24, 28, 30, 51, 28
What is 28
300
These extend from each quartile to the maximum and minimum points that are not outliers.
What is whiskers?
300
What are the Measures of center?
Mean, Median, and Mode
400
What is The Upper fence in the data set 132, 116, 108, 113, 126, 120, 131, 112, 126
What is 152.5
400
Find the IQR of the data set 29, 27, 24, 28, 30, 51, 28
What is 3
400
What is the mean of the data set 22, 27, 25, 11, 29, 28, 41, 26, 28, 23.
What is 26?
400
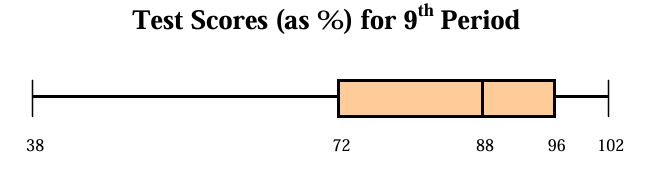 What percent of students made below a 96?
What is 75?
400
Which measure of center is most affected by the skew
What is the mean?
500
There is one outlier in the data set 20, 23, 18, 21, 4, 17, 15 You must show your work
What is 4?
500
The 5-number summary of: 19, 15, 7, 12, 5, 2, 17, 20, 3
What is Median=12 Q3= 18 Q1= 4 Max= 20 Min= 2?
500
Given 3, 6, 9, 12, 19, 22, 31, 33, and X, what would X have to be to average 17
What is 18?
500
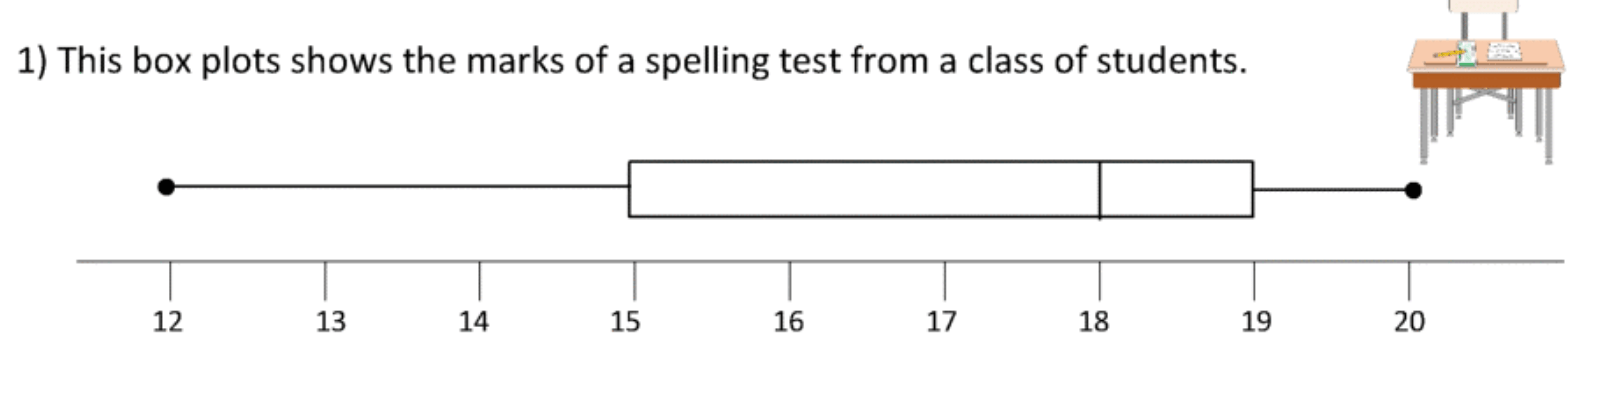 List out the 5 number summary
Min = 12 Q1 = 15 Median = 18 Q3 = 19 Max = 20
500
What is the skew of the given box plot?
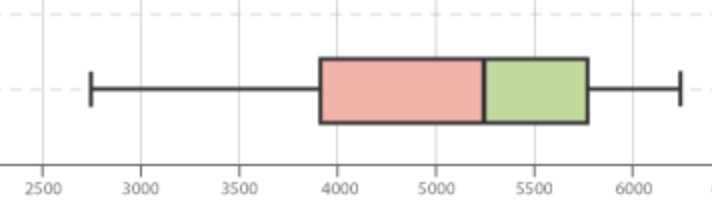
What is left skewed
600
What is the outlier in the data set 91, 92, 88, 89, 93, 95, 65, 85, 91 You must show your work
What is 65
600
The 5-number summary of: 39, 41, 30, 14, 44, 40, 48, 39, 40, 36
What is Median=39.5 Q3= 41 Q1= 36 Max= 48 Min= 14?
600
Find the mean, median, mode, and range of the data set: 82,23,59,94,70, 26, 32, 83, 87, 94, 32
Mean = 62 Median = 70 Mode = 32,94 Range = 71
600
Given the box plot below give an interval that contains 50% of the data
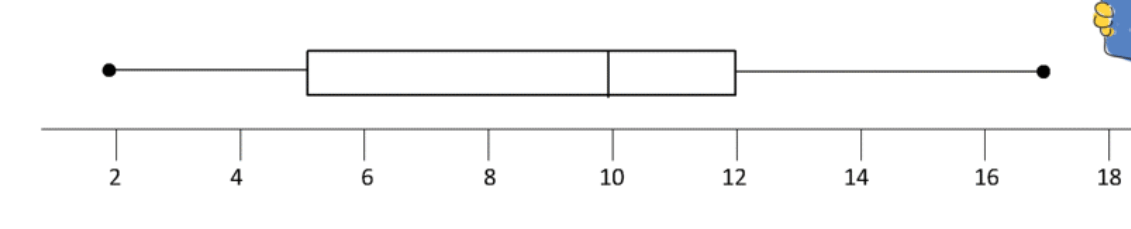
What is:
2-10
5-12
10-17
600
Write the inequality for the measures of center of the graph

What is Mode<median<mean