The 3 M's
Home on the Range
Dots and Plots
Famous on Histogram
The Premiership Quartile
100
Mean, Median and Mode are all a form of what?
Average
100
To find the range of something, what do we have to do?
What is subtract the minimum value from the maximum value?
100
What are the five things we need to create a box plot?
What is minimum, lower quartile, median, upper quartile and maximum?
100
A Histogram shows the frequency of a set of data between a what?
What is a range?
100
On box plot, how many quartiles can we see?
What is 4?
200
Find the median of the following data
12, 8, 3, 15, 1, 9
What is 8.5?
200
Find the Range of the following set of data
15, 92, 14, 58, 11, 76, 15, 48
What is 81?
200
Create a dot plot for the following data 0, 1, 1, 3, 0, 1, 2, 0, 0, 2, 1, 1
will check your answer
200
Draw a Histogram from the following data (Use ranges of 5)
2, 5, 8, 14, 15, 1, 2, 9, 4
Mr. Watkins will check your answer
200
What percentage of data is in the range from the minimum value to the upper quartile?
What is 75%
300
If the mean of Mr. Watkins' footy goals kicked is 1.5, fill in the missing number
1, 3, 0, 0, ?, 2, 5, 1
What is 0?
300
How do we find the interquartile range?
What is the lower quartile subtracted from the upper quartile?
300
Create a box plot using the following data: Maximum = 10 Lower Quartile = 3 Minimum = 1 Median = 6 Upper Quartile = 7
will check your answer
300
Name an advantage of using a Histogram over a Dot Plot
Easier to see data trends
(Other answers may be accepted)
300
What is another name for the 2nd quartile?
What is median?
400
Of Mean, Median and Mode, which one is most appropriate if we wanted to learn what the majority of people enjoyed musically?
What is mode?
400
If the Interquartile range of Mr. Watkins' basketball points is 9 and his upper quartile is 16. What is his lower quartile of basketball points?
What is 7?
400
what is the interquartile range of this box plot?
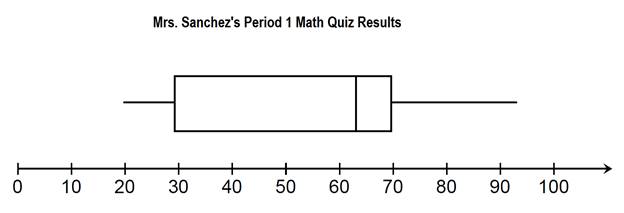
40
400
Draw a Box Plot equivalent of a Histogram that is skewed to the right
will check your answers
400
In a test, if the test scores have a small difference between quartiles, what can I say about my class?
What is consistent?
500
A cricketer's batting average is formed from adding up all their runs and then dividing that by the number of times they have been out. What type of average is this?
What is mean?
500
Cyril Rioli is know for being an explosive player at times but at others can be relatively quiet. Would his interquartile range of disposals be? Small, medium or large?
What is large?
500
What type of average can we see on dot plots, that we can't see on box plots?
What is mode?
500
Nico Rosberg won the 2016 Formula 1 driver's championship by scoring consistent high points. Which way would his Histogram be skewed?
What is to the right?
500
The West Coast Fever netball team has had the following quartiles for their scores in 2017
LQ = 45
Median = 49
UQ = 50.5
And this is their scores against
LQ = 48.5
Median = 56
UQ = 62
Are they more likely to be a top team or bottom team this year? And which is more consistent, their offense or defense?
Bottom and Offense