The 3 M's & Range
Dots & Plots
Histograms
100
To find the range we do this.
What is subtract the minimum value from the maximum value?
100
What are the five things we need to create a box plot?
What is minimum, lower quartile, median, upper quartile and maximum?
100
The shape of this histogram.

What is left skewed?
200
The mode of the data set 5, 8, 15, 6, 9, 8, 4.
What is 8?
200
This box plot has a higher variability in temperature.

What is Pittsburgh?
200
This is frequency of the bin 70-79 of the data set 66, 70, 88, 72, 99, 75, 66, 80, 77.
What is 4?
300
The median of the data set 5, 8, 15, 6, 9, 8, 4
What is 8?
300
The shape of this dot plot.

What is right skewed?
300
The shape (normal/symmetric or skewed) of the histogram for the data set is 5, 3, 3, 2, 1, 4, 4, 3.
What is normal/symmetric?
400
The range of the data set 5, 8, 15, 6, 9, 8, 4
what is 11
400
This dot plot has a higher mean.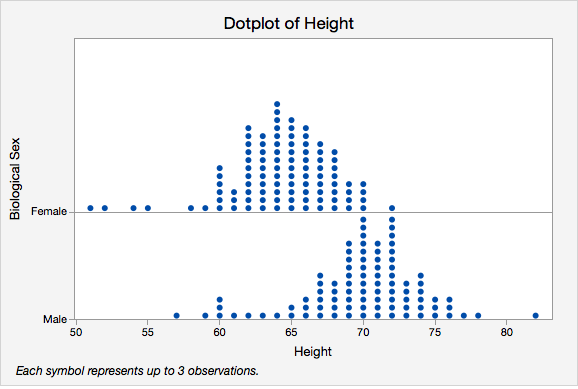
What is male?
400
The type of average we can see on histograms that we can't see on box plots.
What is mode?
500
The mean of the data set 5, 8, 15, 6, 9, 8, 4 (rounded to nearest thousandths).
What is 7.86?
500
The data set is 5, 3, 3, 2, 1, 4, 4, 3. The first (lower) quartile value would be this. (hint: think of creating a box plot)
What is 2?
500
This is the inter-quartile range of the data set 2, 5, 7, 6, 4, 3, 5.
What is 3?