The 3 M's & Range
Dots & Plots
Histograms
Frequency Tables
Grab Bag & Correlation
100
To find the range we do this.
What is subtract the minimum value from the maximum value?
100
What are the five things we need to create a box plot?
What is minimum, lower quartile, median, upper quartile and maximum?
100
 Approximately, how many people were surveyed?
What is 184? (180-190)
100
This is the frequency of the age in the interval 50-59.

What is 5?
100
Identify the outlier for the data set 15, 20, 18, 22, 88, 14.
What is 88?
200
The mode of the data set 5, 8, 15, 6, 9, 8, 4.
What is 8?
200
Which bookstore has a higher variability?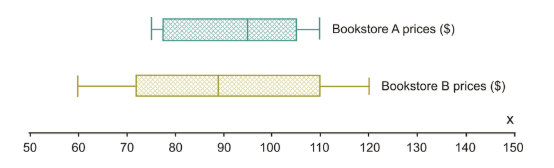
Book store B.
200
This is frequency of the interval 70-79 of the data set 66, 70, 88, 72, 99, 75, 66, 80, 77.
What is 4?
200
A survey of 9th and 10th graders was given to determine what their favorite subject was. 72 said Math (50 which were freshmen), 38 said Social Studies (20 which were sophomores), and 40 freshmen and 50 sophomores said PE was their favorite. The number of students surveyed.
What is 200?
200
What percentage of data is in the range from the minimum value to the upper quartile?
What is 75%
300
The median of the data set 5, 8, 15, 6, 9, 8, 4
What is 8?
300
 What are the measures of central tendency of this dot plot?
The mean, median and mode are 2.
300
Approximately, how many people that are atleast 21 like M & M's?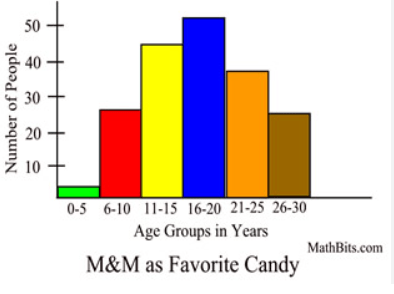
What is 65? (55-65)
300
A survey of 9th and 10th graders was given to determine what their favorite subject was. 72 said Math (50 which were freshmen), 38 said Social Studies (20 which were sophomores), and 40 freshmen and 50 sophomores said PE was their favorite. How many freshmen said their favorite subject is Social Studies?
What is 18?
300
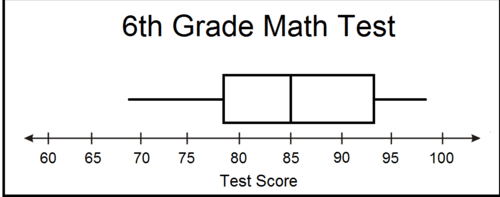 If 120 students took the test, how many received between a 79% and a 93%?
60 students
400
The mean of the data set 5, 8, 15, 6, 9, 8, 4 (rounded to nearest thousandths).
What is 7.86?
400
This dot plot has a higher mean.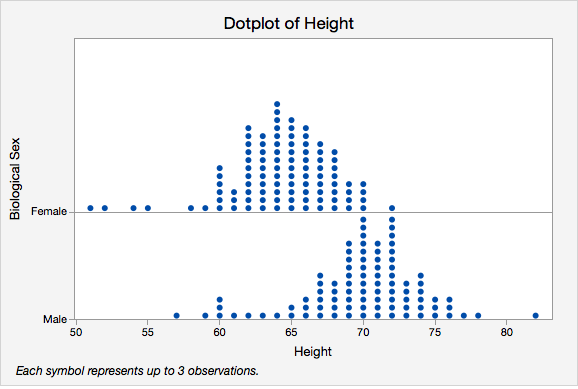
What is male?
400
The type of measure of central tendency we can see on histograms that we can't see on box plots.
What is mode?
400
A survey of 9th and 10th graders was given to determine what their favorite subject was. 72 said Math (50 which were freshmen), 38 said Social Studies (20 which were sophomores), and 40 freshmen and 50 sophomores said PE was their favorite. What percent of of students said math were their favorite?
What is 36%?
400
Write an inference comparing the prices at the book stores.
Bookstore A prices are higher than Bookstore B. (the median is greater, which means the average will be greater)
500
A cricketer's batting average is formed from adding up all their runs and then dividing that by the number of times they have been out. What type of average is this?
What is mean?
500
The data set is 5, 3, 3, 2, 1, 4, 4, 3. The first (lower) quartile value would be this. (hint: think of creating a box plot)
What is 2?
500
This is the inter-quartile range of the data set 2, 5, 7, 6, 4, 3, 5.
What is 3?
500
A survey of 9th and 10th graders was given to determine what their favorite subject was. 72 said Math (50 which were freshmen), 38 said Social Studies (20 which were sophomores), and 40 freshmen and 50 sophomores said PE was their favorite. What percent of of those who said math were their favorite are sophomores?
What is 31%?
500
Which has a higher mean number of hours?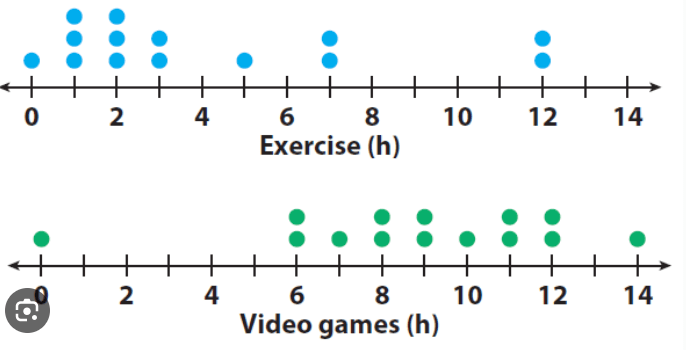
The number of hours playing video games.